Economic Developments - September 2024
For a PDF version of this report, click here.
Despite a meaningful pullback in mortgage rates over the past few months, home purchase activity continues to be unresponsive, with existing home sales remaining near cycle lows. Lock-in effects and affordability constraints are keeping many would-be homebuyers on the sidelines. While we have made little change to our macroeconomic outlook, we have revised downward our near-term home sales forecast. We now expect 2024 total home sales to be 4.7 million (previously 4.8 million), down 0.3 percent from their 2023 total; notably, we also expect 2024 existing home sales to fall to the slowest annual pace since 1995. We forecast sales to then pick up by 9.8 percent in 2025 to a pace of 5.1 million units; with the majority of that increase coming in the second half of 2025 if mortgage rates decline sufficiently to end 2025 at 5.7 percent, as we currently project. Our forecast for total single-family mortgage originations was revised downward modestly for 2024 to $1.68 trillion (previously $1.70 trillion), while the outlook for 2025 was moved slightly higher to $2.16 trillion (previously $2.15 trillion), principally due to a rise in refinance volumes from anemic levels. For economic growth, we expect 2024 Real Gross Domestic Product Growth (GDP) to be 2.0 percent on a Q4/Q4 basis (1.9 percent previously) and 2025 growth to be 1.8 percent (unchanged), and for the unemployment rate to gradually drift upward to 4.6 percent by end of 2025.
Labor Market Data Caused a Growth Scare, but Continued Expansion Still Expected
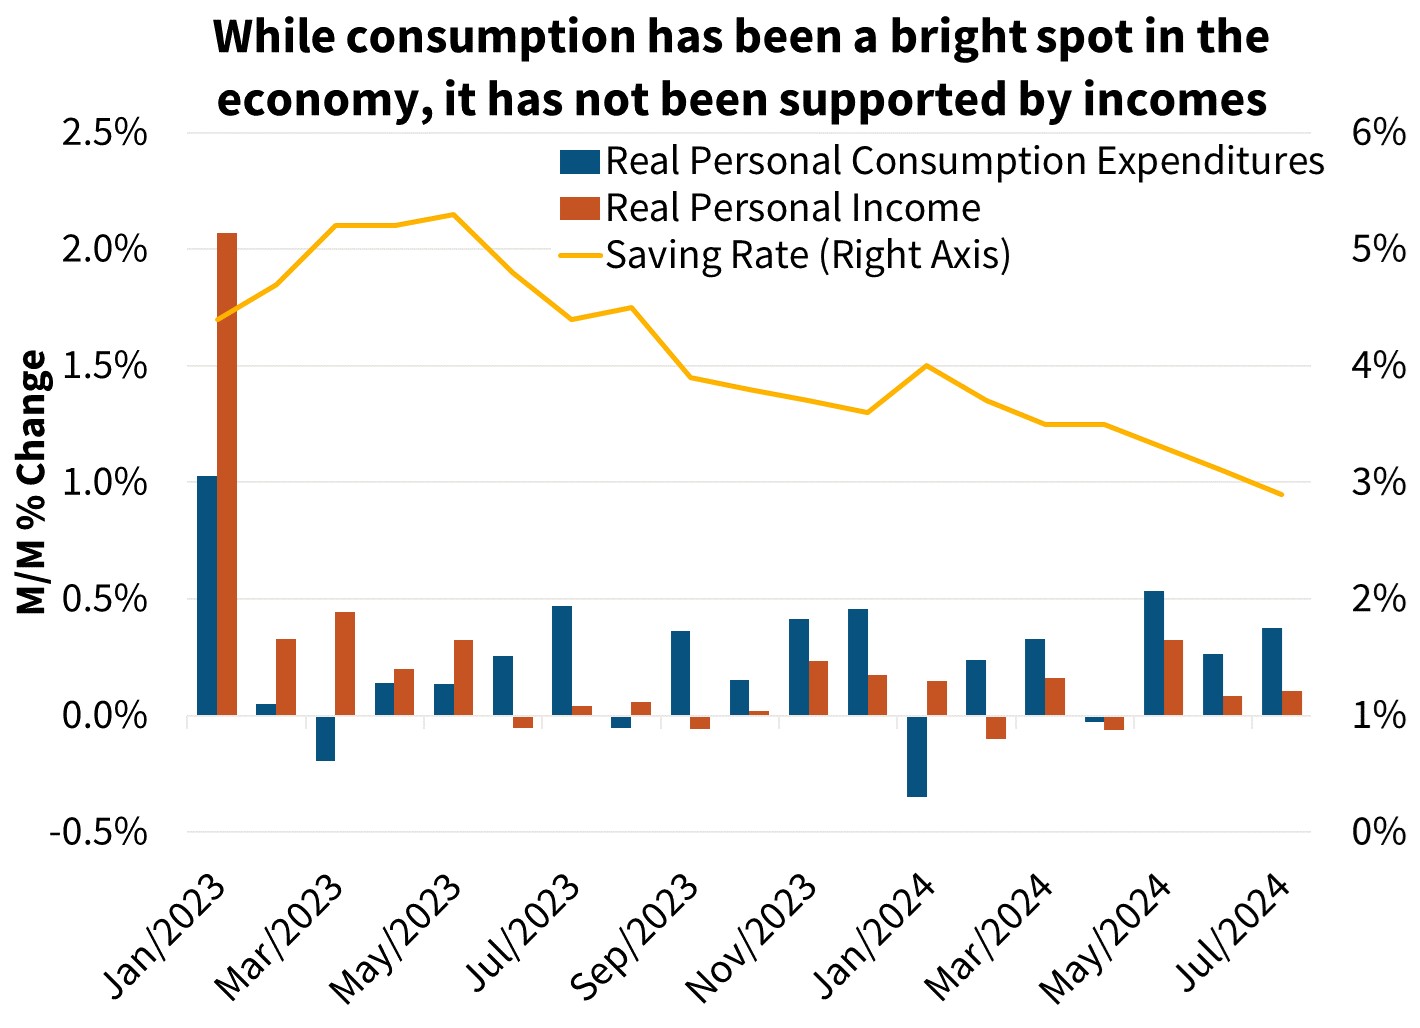
With inflation continuing to move toward the Federal Reserve's target and most labor market data softening, we believe economic growth is in the process of downshifting, even though consumer spending to date has remained more resilient than previously expected. Fed commentary has stated that risks to their dual mandate – maximum employment and stable prices – are now better balanced and a rate-cutting cycle is imminent.
On balance, our growth forecast is largely unchanged compared to last month. While we have upgraded our third quarter growth expectations due to stronger base effects from the higher second quarter reading, we continue to expect that growth will slow in line with business surveys and signs of a weaker labor market. We now forecast 75 basis points of fed funds rate cuts by the end of the year, spread evenly between the Fed’s three remaining meetings. We anticipate that rates will continue to decline through next year and, with a lag, will provide a boost to the economy as monetary policy transitions from a restrictive to a neutral stance. We expect GDP growth will return to roughly its long-term potential by the end of 2025.
Rising Regional Variation in Housing Market as Sales Fail to Respond to Easing Mortgage Rates
Despite an easing in mortgage rates, the lock-in effect remains strong as the bulk of existing mortgage borrowers still have notes with rates well below current market rates. This is likely continuing to keep many would-be homebuyers and home-sellers on the sidelines. Based on Fannie Mae’s book of outstanding single-family mortgage loans, as of June 30, 2024, approximately 80 percent of 30-year fixed rate loans had note rates at least 100 basis points below the average 30-year fixed-rate mortgage rate of 6.20 percent, as of September 12, 2024, as measured by Freddie Mac’s weekly mortgage rate survey. More than 60 percent had a note rate greater than 200 basis points below the current average market rate . Affordability constraints also continue to be a challenge aside from any lock-in disincentives.
On a national basis, the inventory of homes listed for sale continues to nudge upward. According to the National Association of REALTORS®, the number of homes on the market at the end of July was up 19.8 percent from a year prior. However, this rise in homes on the market is not occurring because of a significant increase in new listings. Rather, the pace of sales has been so weak that new listings on average are remaining on the market longer. .
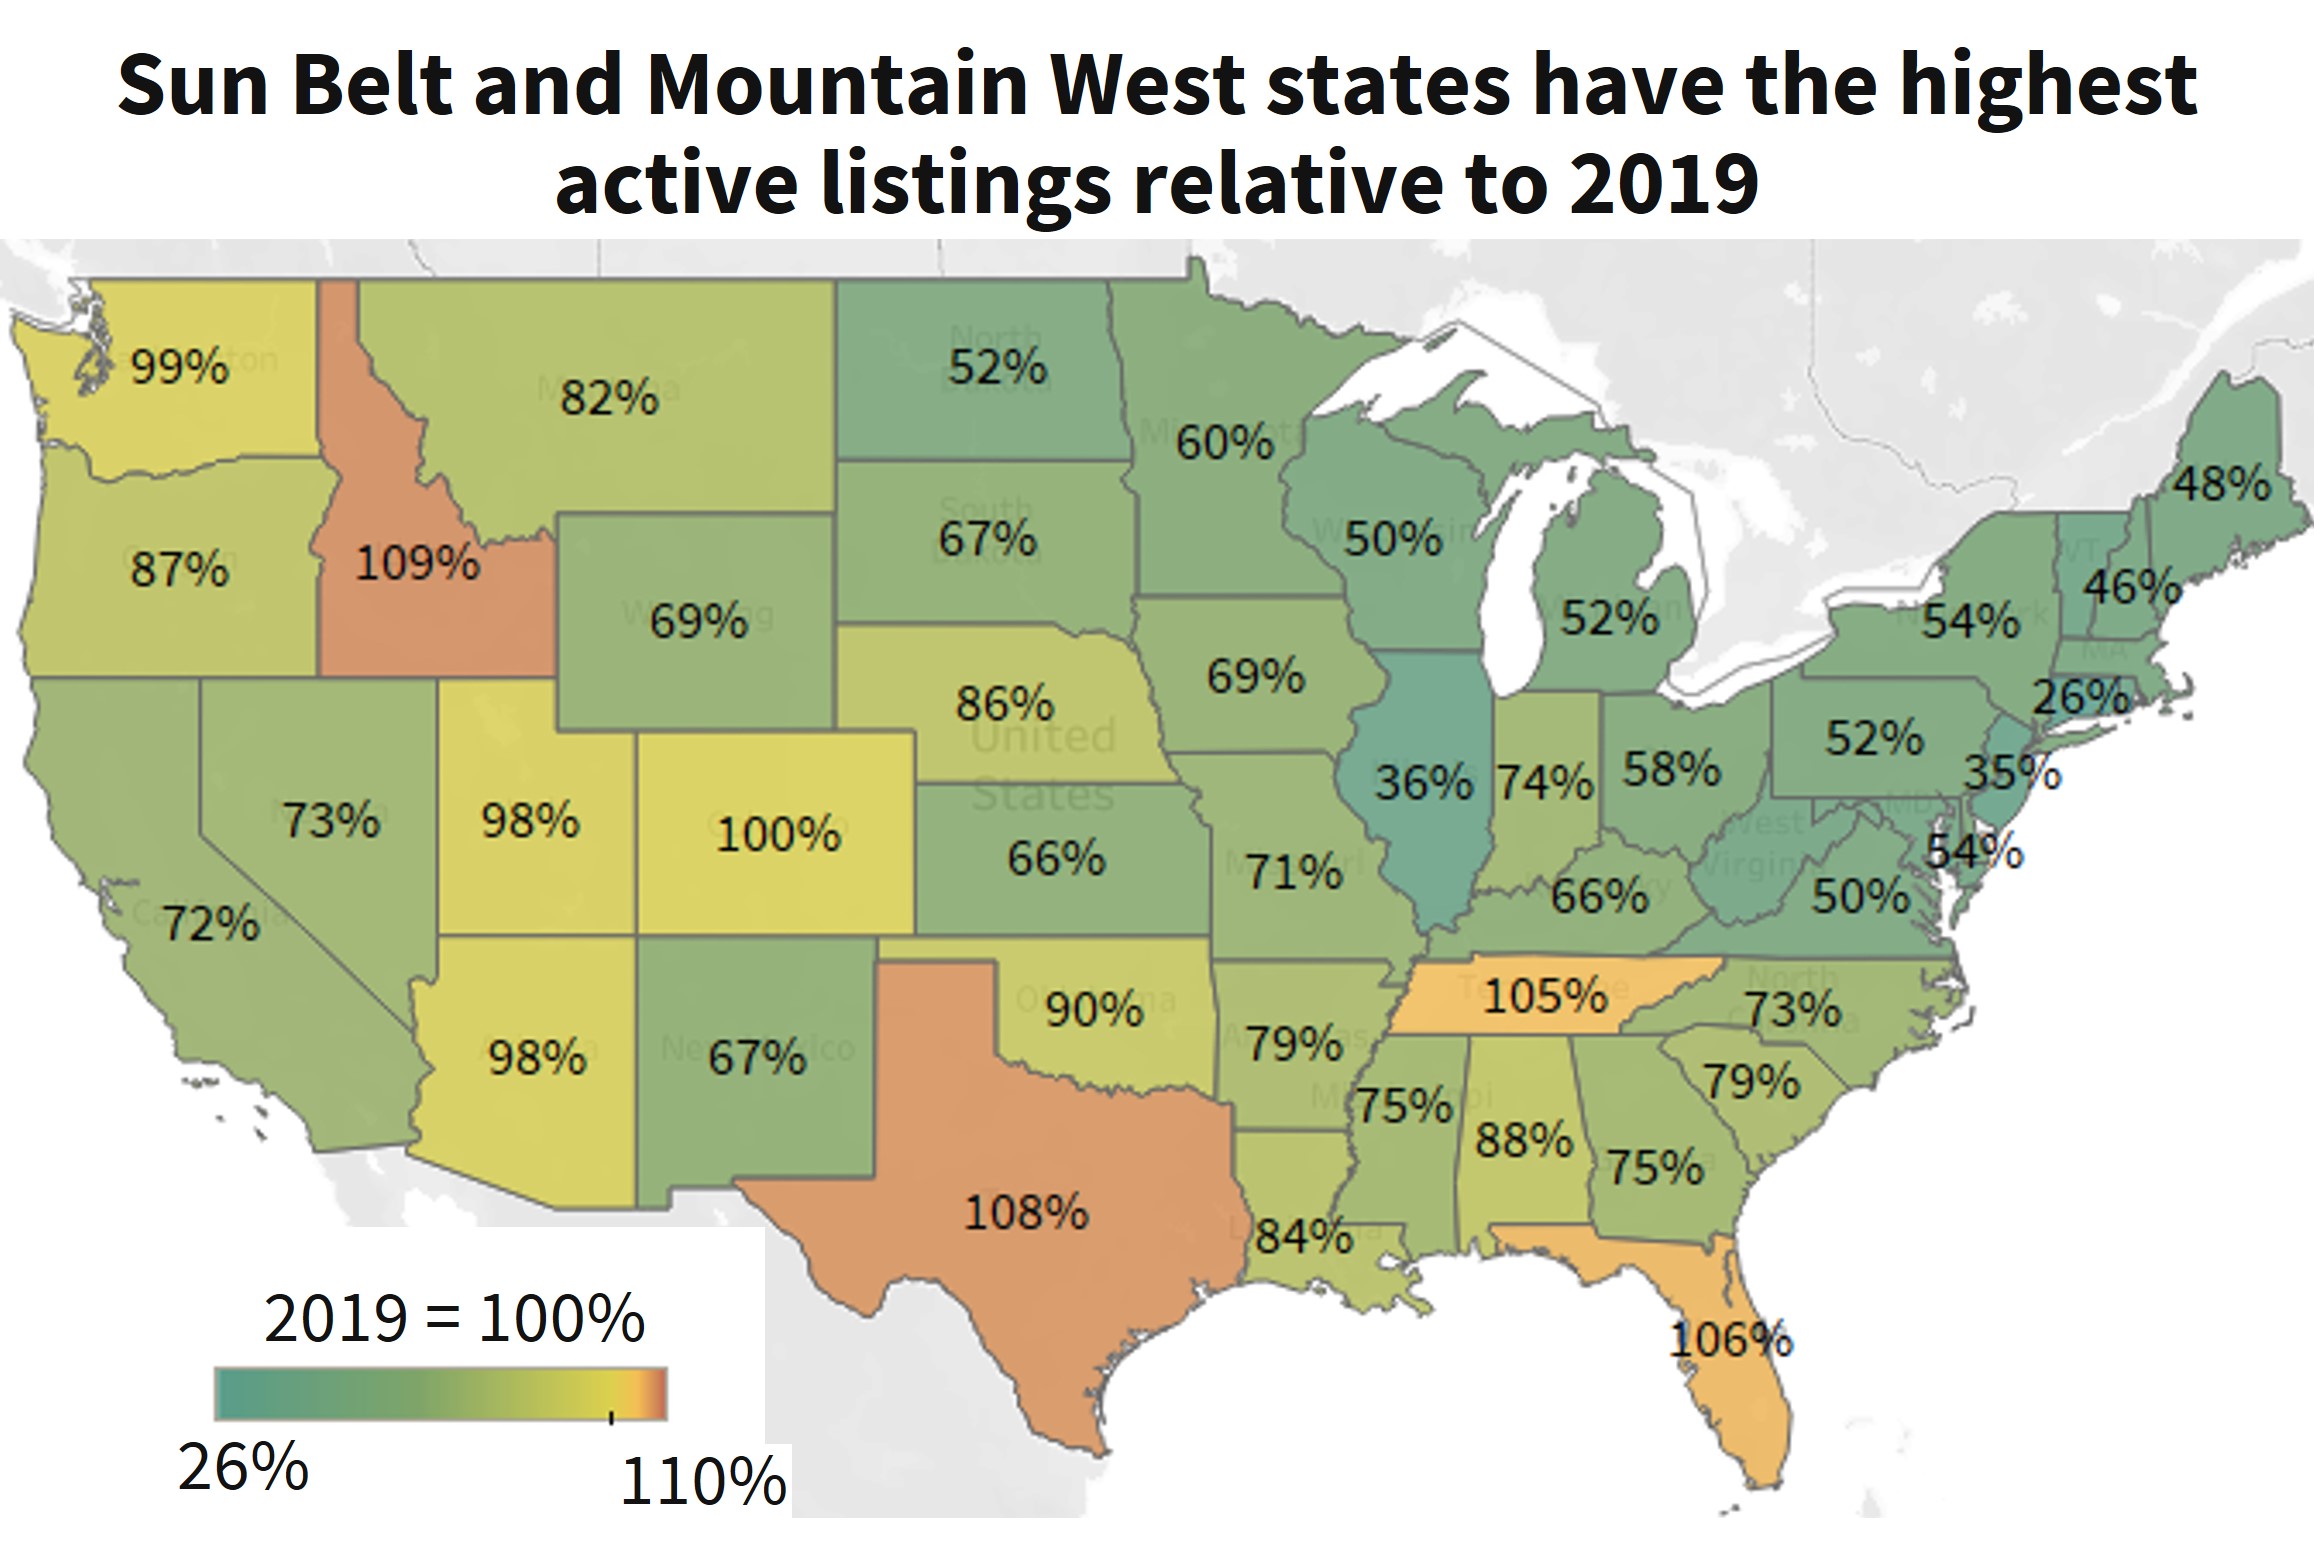
While there are likely many factors driving this divergence, an examination of the states driving the rise in homes for sale shows that these they tend to have two characteristics in common. First, the cumulative home price gains since the pandemic have tended to be some of the largest, creating a larger relative shock to affordability for residents in these states. 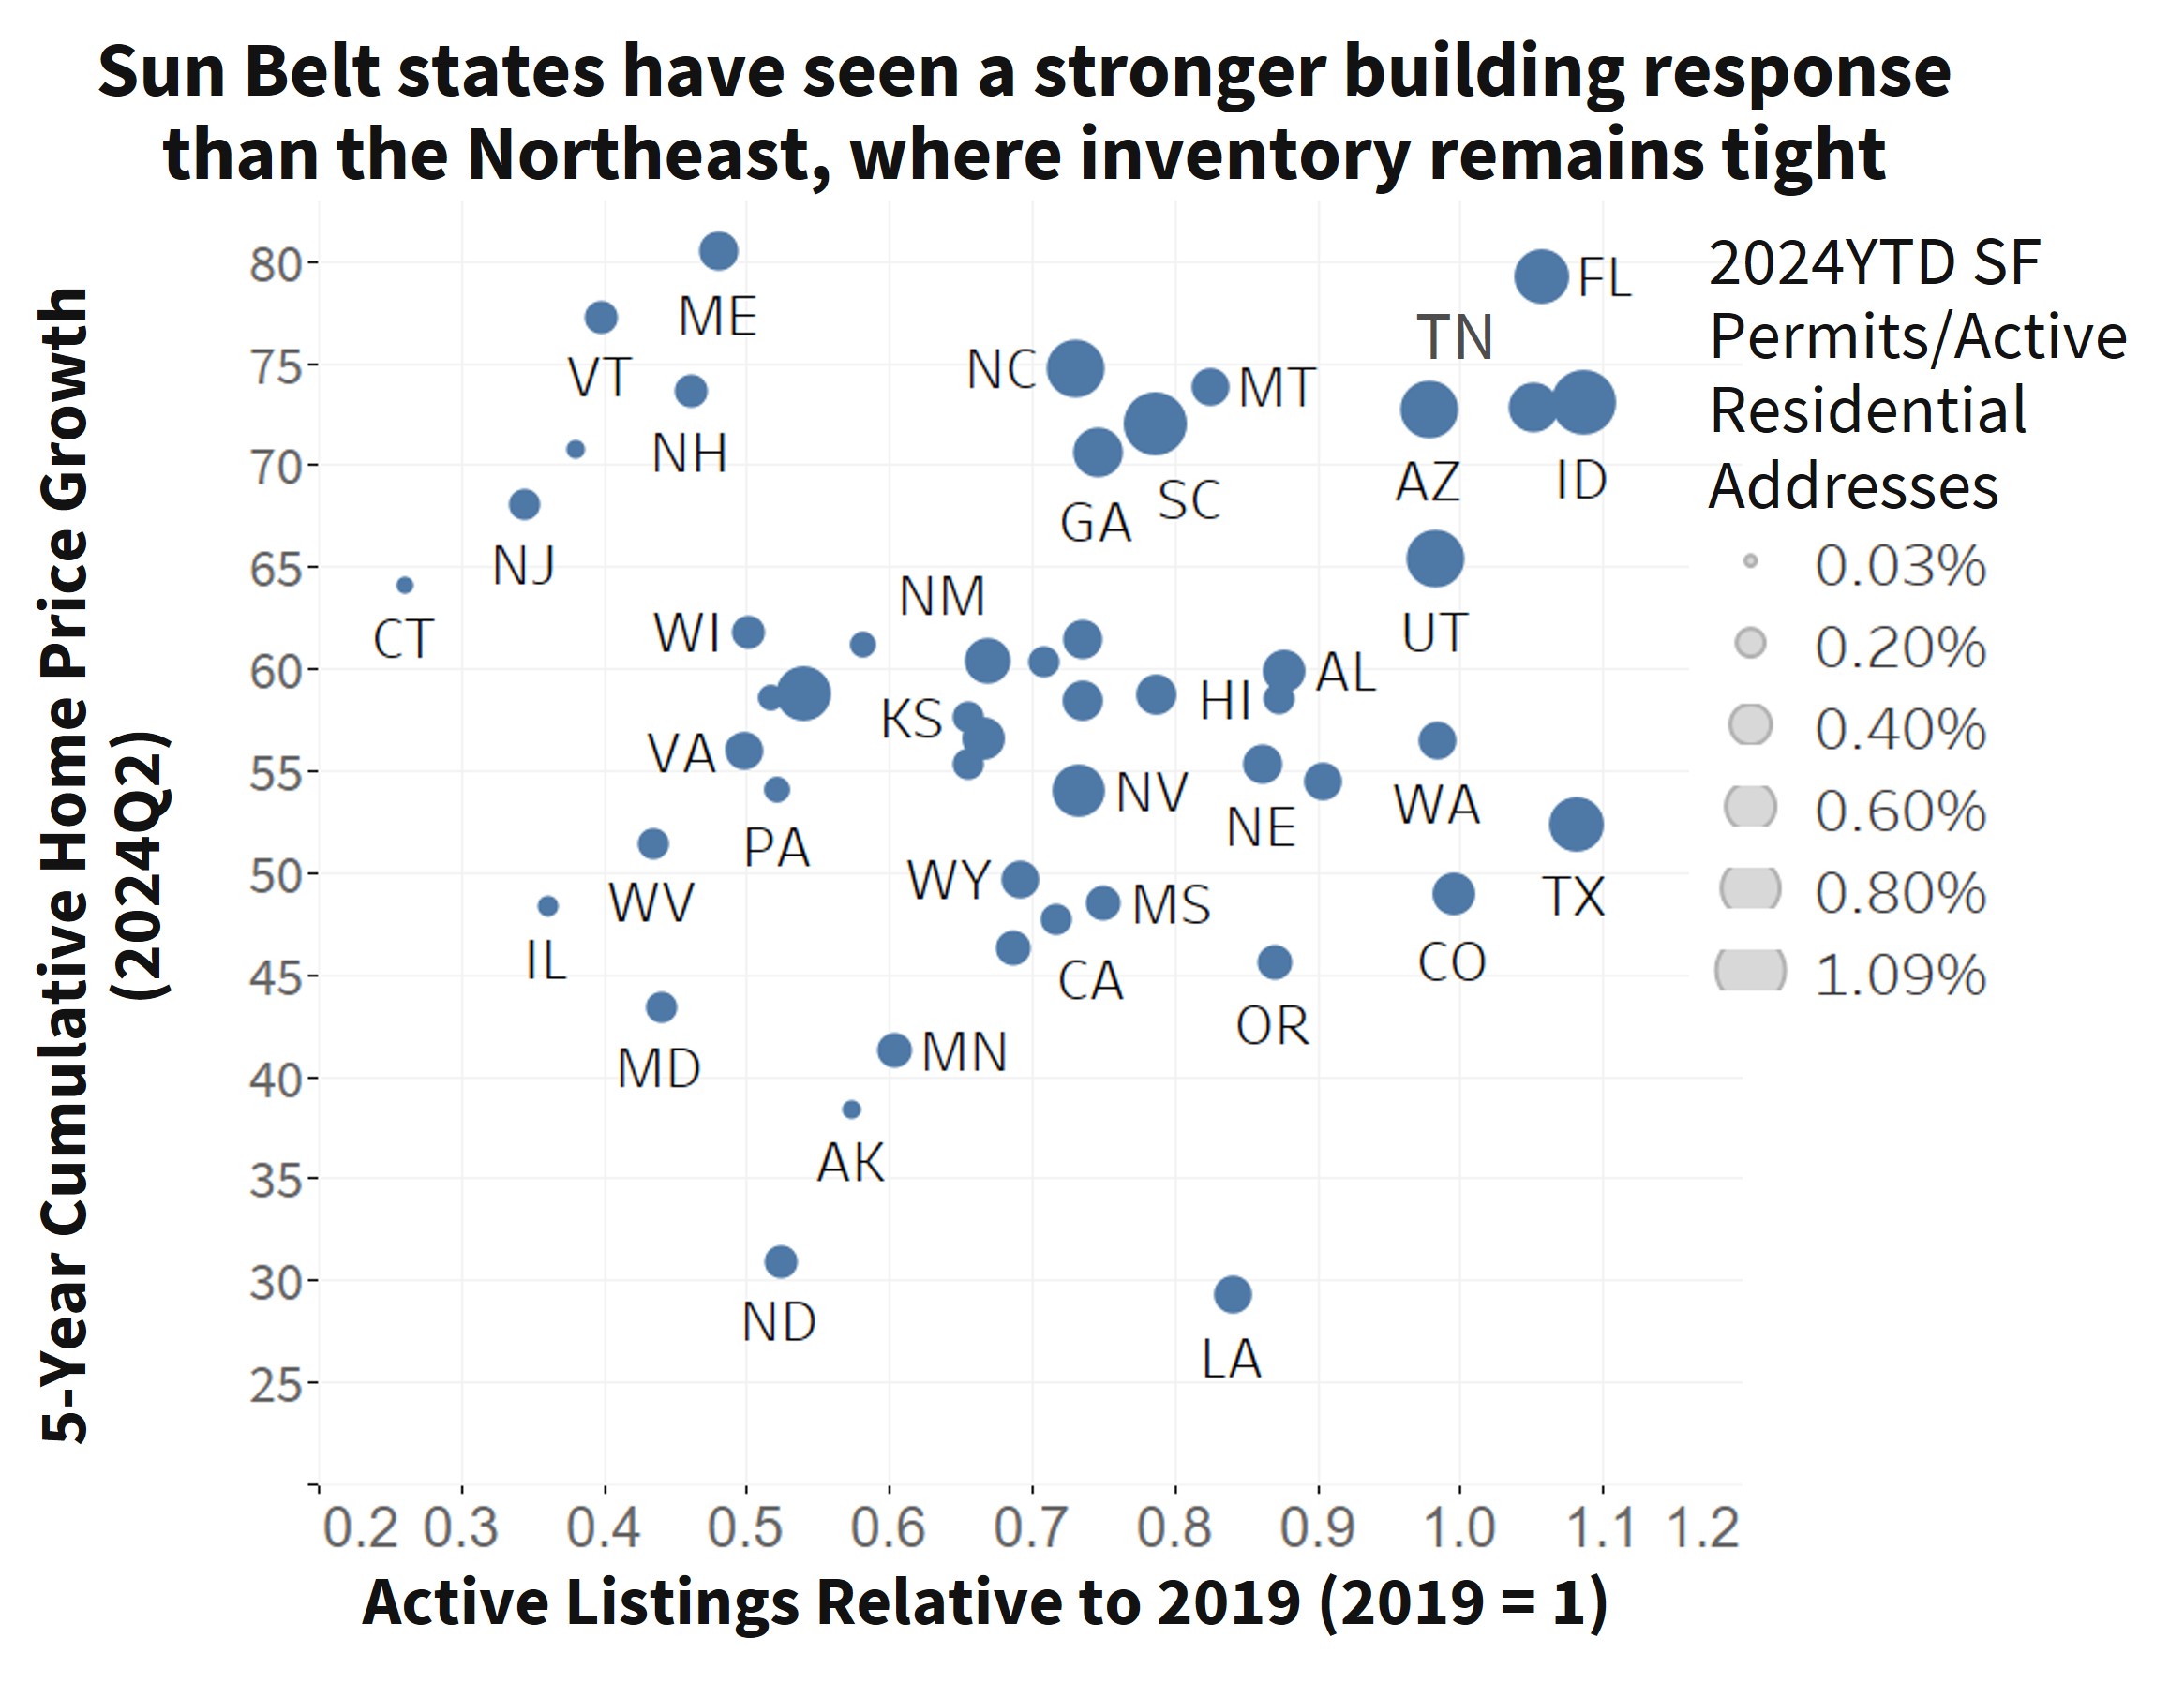
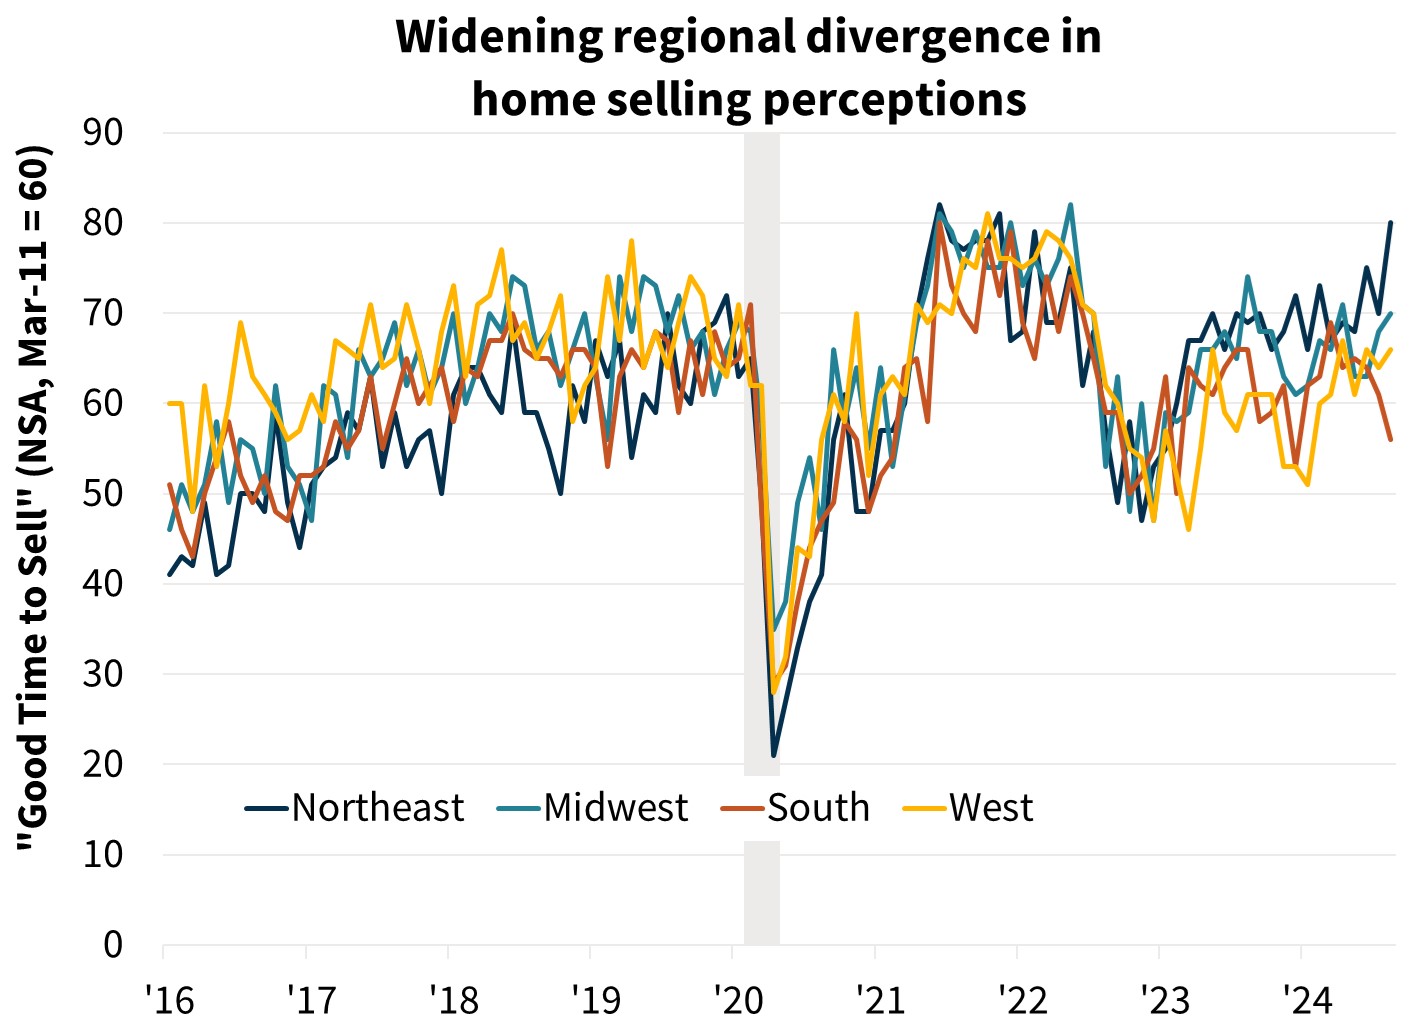
In contrast, inventories remain subdued in most other states. Listings being put onto the market are continuing to find adequate buyer interest either because the relative affordability shock in recent years has been comparatively small (as is the case in much of the Midwest), and/or there has been limited new home construction as an alternative (as is the case in the smaller states in the Northeast, which has also seen some of the strongest home price gains as demand shifted away from the New York and Boston metro areas). These dynamics appear to have affected household attitudes. In recent months there has been a widening regional divergence of consumer sentiment on whether it’s a “good time to sell” in Fannie Mae’s Home Purchase Sentiment Index®. Respondents in the Northeast are increasingly saying it’s a good time to sell, perhaps indicating the ongoing tight inventories and shorter time on the market, while respondents in the South have become more downbeat about selling conditions.
Economic Forecast Changes
Economic Growth
The second estimate of Q2 2024 GDP was revised upward by two-tenths to an annualized 3.0 percent, driven by an upward revision to consumption. This higher starting level led to an upward revision to our Q3 forecast, though we maintain our expectation of weakness in Q4 and the first quarter of 2025. Our GDP forecast for total yearly growth in 2024 on a Q4/Q4 basis was revised upward one-tenth to 2.0 percent. Our forecast for growth in 2025 was unchanged at 1.8 percent Q4/Q4.

Labor Market
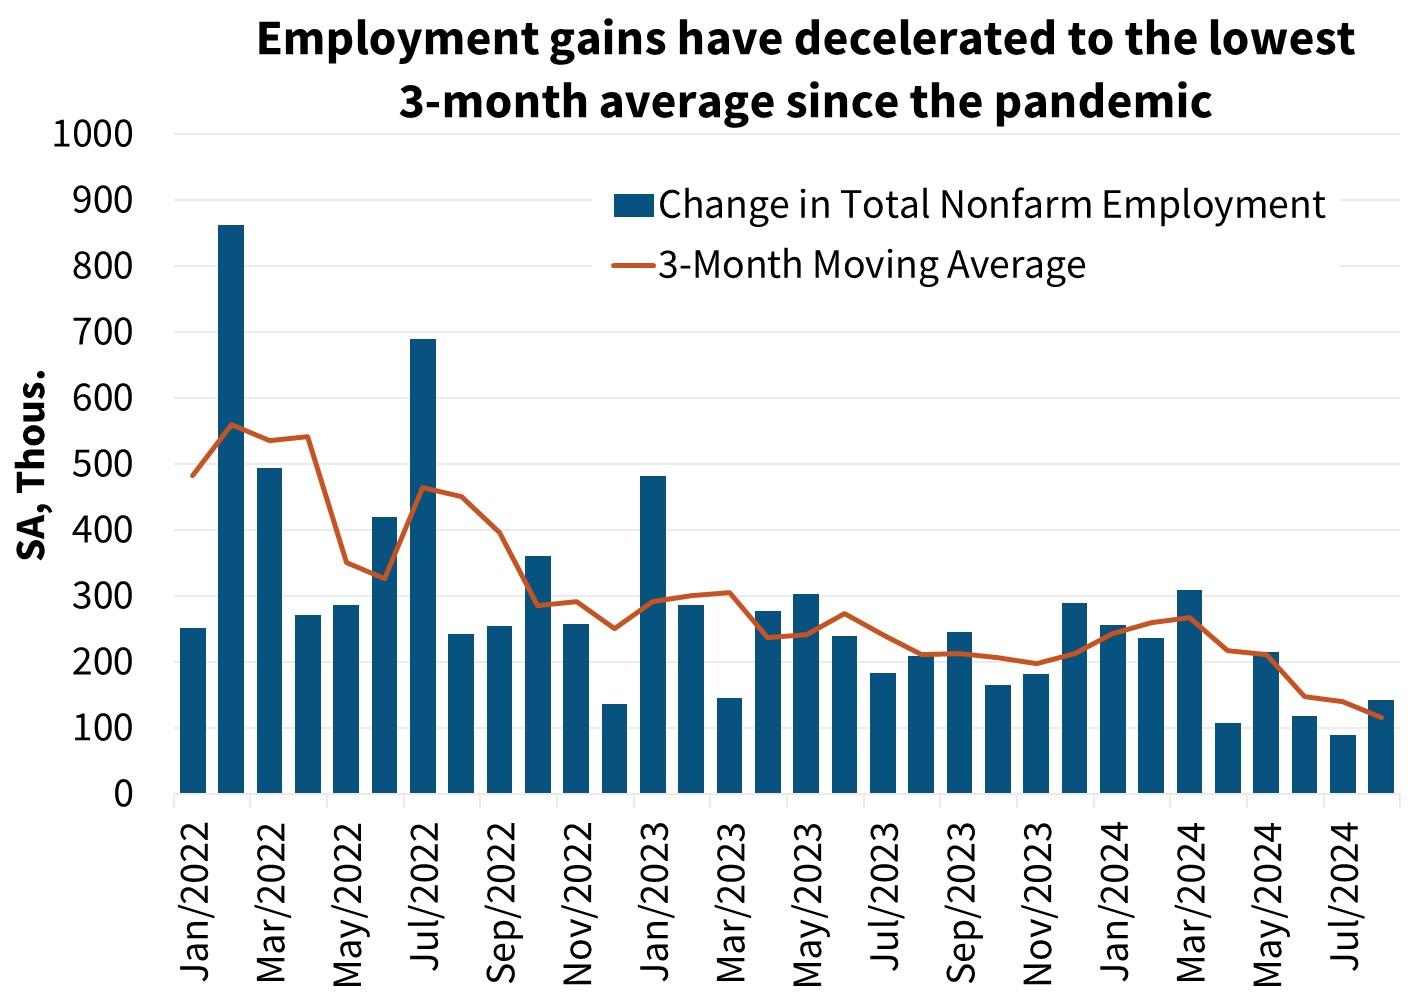
Nonfarm payroll employment growth was muted in August, growing by just 142,000, while the June and July employment figures were revised downward by a combined 86,000. The unemployment rate fell one-tenth to 4.2 percent, ending a four-month string of increases. Given this, our unemployment rate expectations were unchanged, and we continue to expect the labor market to cool at a gradual pace.

Inflation & Monetary Policy
Our inflation outlook was revised downward following a downward revision to our oil price outlook. The August Consumer Price Index (CPI) report was in line with our expectations for further deceleration in inflation. We continue to forecast inflation to moderate over our forecast horizon.
Given the inflation numbers and signs of cooling in the labor market, our baseline expectation remains that the Fed will begin to cut the federal funds rate in September by 25 basis points, followed by 25-basis point cuts at both the November and December meetings..

Housing & Mortgage Forecast Changes
Mortgage Rates
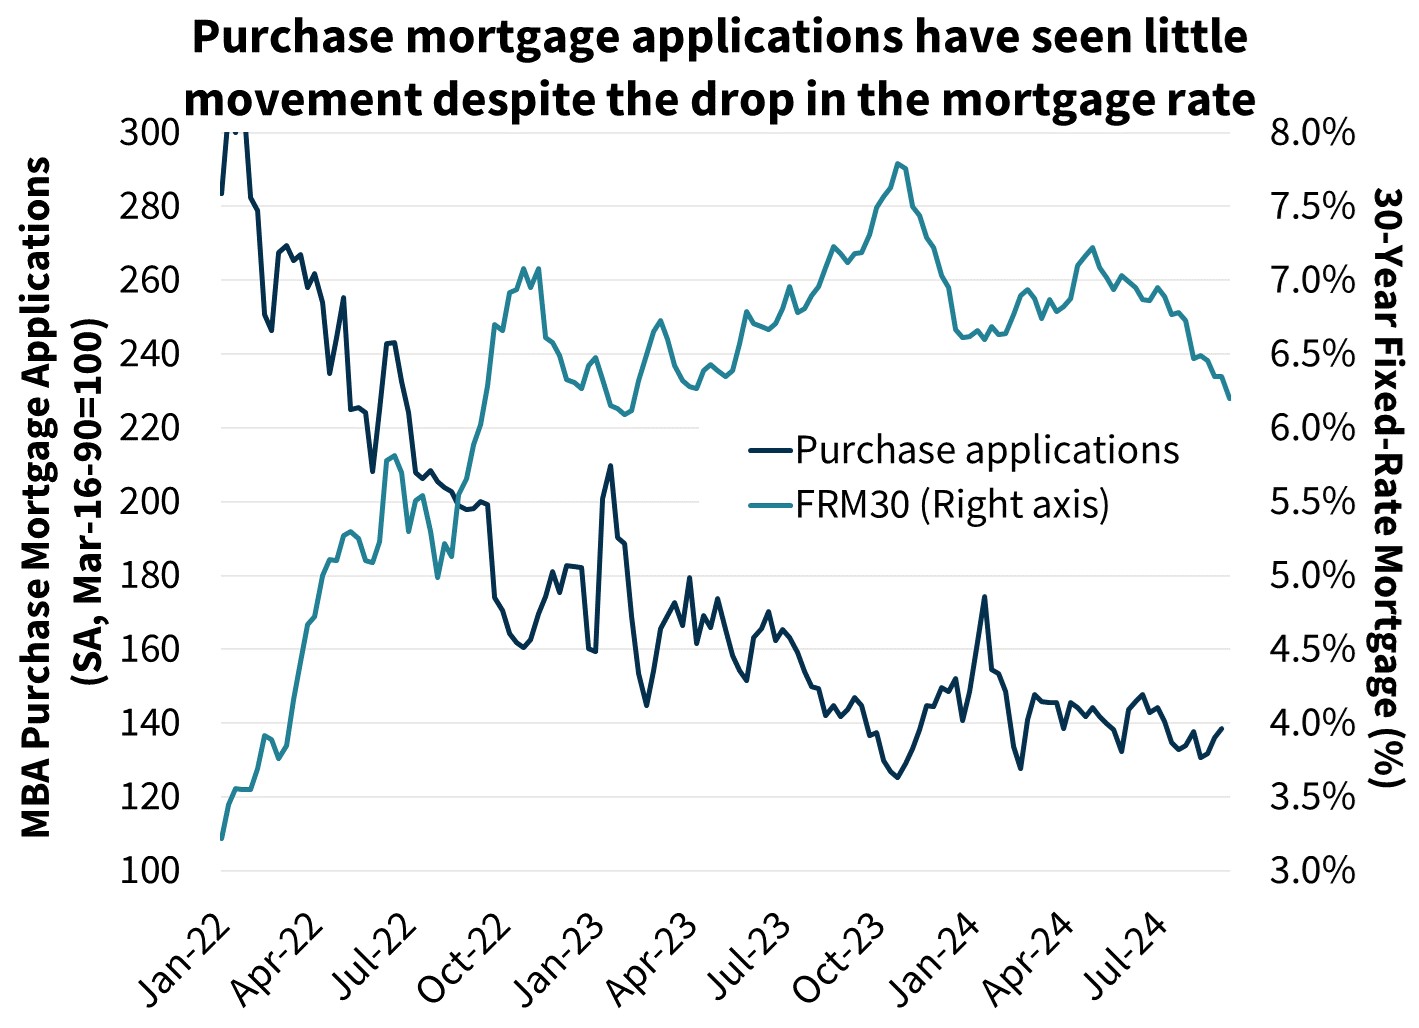
We revised downward our mortgage rate forecast for 2024 given the recent decline in longer-term interest rates. We now forecast the 30-year fixed mortgage rate to average 6.6 percent in 2024 (down one-tenth from last month’s forecast) and to average 5.9 percent in 2025, down one-tenth. However, interest rates remain volatile, particularly given changes to Fed policy expectations, which adds risk to our outlook. Following the completion of our beginning-of-the-month interest rate forecast and as of this writing, 10-year Treasury rates have decreased approximately 26 basis points, leading to some downside risk to our current baseline mortgage rate forecast.

Existing Home Sales
Existing home sales rose 1.3 percent to a seasonally adjusted annualized rate (SAAR) of 3.95 million in July. We revised downward our near-term outlook for existing home sales, despite the lower mortgage rate path, given the weakness in recent high-frequency indicators, such as purchase applications, which have shown little movement despite the drop in mortgage rates. However, we continue to forecast existing sales to trend gradually upward over our forecast horizon as affordability slowly improves and lock-in effects weaken.

New Home Sales
New single-family home sales jumped 10.6 percent in June to a SAAR of 739,000. We have upwardly revised our new home sales outlook following the strong July report, and we continue to expect the dearth of existing homes being listed for sale to help support new home sales and lead to a gradual increase over the forecast horizon.

Single-Family Housing Starts
We’ve revised downward our expectation for single-family housing starts, as incoming data point to a weaker near-term outlook for single-family construction, as well as a growing stock of homes for sale already started. Starts fell sharply in July, and other indicators, such as permits along with low homebuilder confidence, continue to suggest a lower path.

Multifamily Housing Starts
We have downgraded our multifamily housing starts forecast. While the multifamily starts series is notoriously volatile, we continue to believe demographic trends will be supportive of multifamily construction further out in the future once the current high level of units in the construction pipeline work their way onto the market over the next couple of years.

Single-Family Home Prices
Our most recent home price forecast was in our July forecast, where we forecast national home prices to rise 6.1 percent in 2024 and 3.0 percent in 2025 on a Q4/Q4 basis. Our next home price update will be in October
")
Single-Family Mortgage Originations
We expect 2024 purchase origination volume to be $1.3 trillion, a downward revision of $20 billion from the prior forecast. This revision is driven by a somewhat weaker expectation for existing home sales. In 2025, we expect purchase volumes to grow by 15 percent year over year to $1.5 trillion.
For refinances, we now expect 2024 volume to be $375 billion, a slight upward revision from last month’s forecast given the lower mortgage rate path. We expect 2025 volumes to come in at $649 billion, an upward revision of $23 billion from the prior forecast, again driven by the lower expected mortgage rate path. These upward revisions are consistent with a slight uptick in refinance application activity lately compared to earlier in the summer, as seen in the Fannie Mae Refinance Application-Level Index (RALI).

Economic & Strategic Research (ESR) Group
September 15, 2024
For a snapshot of macroeconomic and housing data between the monthly forecasts, please read ESR's Economic and Housing Weekly Notes.
Data sources for charts: Bureau of Labor Statistics, Bureau of Economic Analysis, Mortgage Bankers Association, Freddie Mac, Realtor.com, Federal Housing Finance Agency, US Postal Service, Census Bureau, Fannie Mae Home Purchase Sentiment Index
Opinions, analyses, estimates, forecasts, beliefs, and other views of Fannie Mae's Economic & Strategic Research (ESR) Group included in these materials should not be construed as indicating Fannie Mae's business prospects or expected results, are based on a number of assumptions, and are subject to change without notice. How this information affects Fannie Mae will depend on many factors. Although the ESR group bases its opinions, analyses, estimates, forecasts and other views on information it considers reliable, it does not guarantee that the information provided in these materials is accurate, current or suitable for any particular purpose. Changes in the assumptions or the information underlying these views could produce materially different results. The analyses, opinions, estimates, forecasts, beliefs, and other views published by the ESR group represent the views of that group as of the date indicated and do not necessarily represent the views of Fannie Mae or its management.
ESR Macroeconomic Forecast Team
- Doug Duncan, SVP and Chief Economist
- Mark Palim, VP and Deputy Chief Economist
- Eric Brescia, Economics Manager
- Nick Embrey, Economics Manager
- Eric Hardy, Economist
- Nathaniel Drake, Economic Analyst
- Richard Goyette, Economic Analyst
- Daniel Schoshinski, Economic Analyst
- Ryan Gavin, Economic Analyst