Economic Developments - June 2024
For a PDF version of this report, click here.
Recent incoming data have generally indicated slower growth. When combined with revisions to the Q1 2024 real gross domestic product (GDP) report, this has led to a modest downgrade of our full year 2024 GDP outlook. We now project 2024 growth to be 1.6 percent on a Q4/Q4 basis (down from 1.8 percent previously), while our outlook for 2025 remains unchanged at 1.9 percent. The most recent inflation data have been encouraging but also noisy, so additional data will be needed to confirm the decelerating trend. Still, we expect core inflation to gradually decline on a quarterly basis through the remainder of year, and we now expect the Federal Reserve to initiate a first cut to the short-term rate in December. This is later than our prior outlook of a September cut and is based on recent Fed guidance, as well as both economic and market data.
Recent home sales data have also been weaker than we had previously anticipated, resulting in a modest downward revision to our near-term outlook. We now project 2024 total home sales to be 4.82 million (previously 4.89 million), and 5.27 million in 2025 (previously 5.29 million). Given the slight change to the sales outlook, we forecast total mortgage originations to be $1.71 trillion in 2024 (previously $1.73 trillion) and $2.07 trillion in 2025 (previously $2.08 trillion). For-sale listings continue to trend upward without a corresponding rise in sales, although listings are still at low levels relative to recent years. This is driving some regional markets, mostly concentrated in the Sunbelt, to begin exhibiting a more equal balance between supply and demand. We believe this development is consistent with our view of decelerating house price growth through the rest of the year.
Near-Term Growth Outlook Softens
The second estimate of Q1 2024 GDP growth was revised downward three-tenths to a 1.3 percent annualized rate. The most significant revision was to personal consumption, which was revised downward five-tenths to 2.0 percent annualized, a significantly weaker picture of personal consumption spending than in the initial release. Combined with a weak April personal consumption report, in which real spending declined by 0.6 percent annualized over the month, it is now evident that consumer spending momentum was weaker entering the second quarter than previously thought. The earlier-than-normal timing of Easter this year, along with some March sales events at major retailers, helps to explain some of the weakness in the April number. However, given that the personal saving rate is at a very low level of 3.6 percent and personal consumption growth has outpaced income growth in recent years, we continue to see the consumer retrenching somewhat going forward. Some major fast food and retail firms have also pointed to softening consumer demand in earnings reports.
Unlike consumer spending, the May payroll employment report surprised to the upside, with 272,000 net jobs added. This figure stood in sharp contrast to the household survey measure of employment from which the unemployment rate is derived. The household survey indicated an outright decline of 408,000 employed persons and showed the unemployment rate ticking up one-tenth to 4.0 percent, the highest since January 2022.
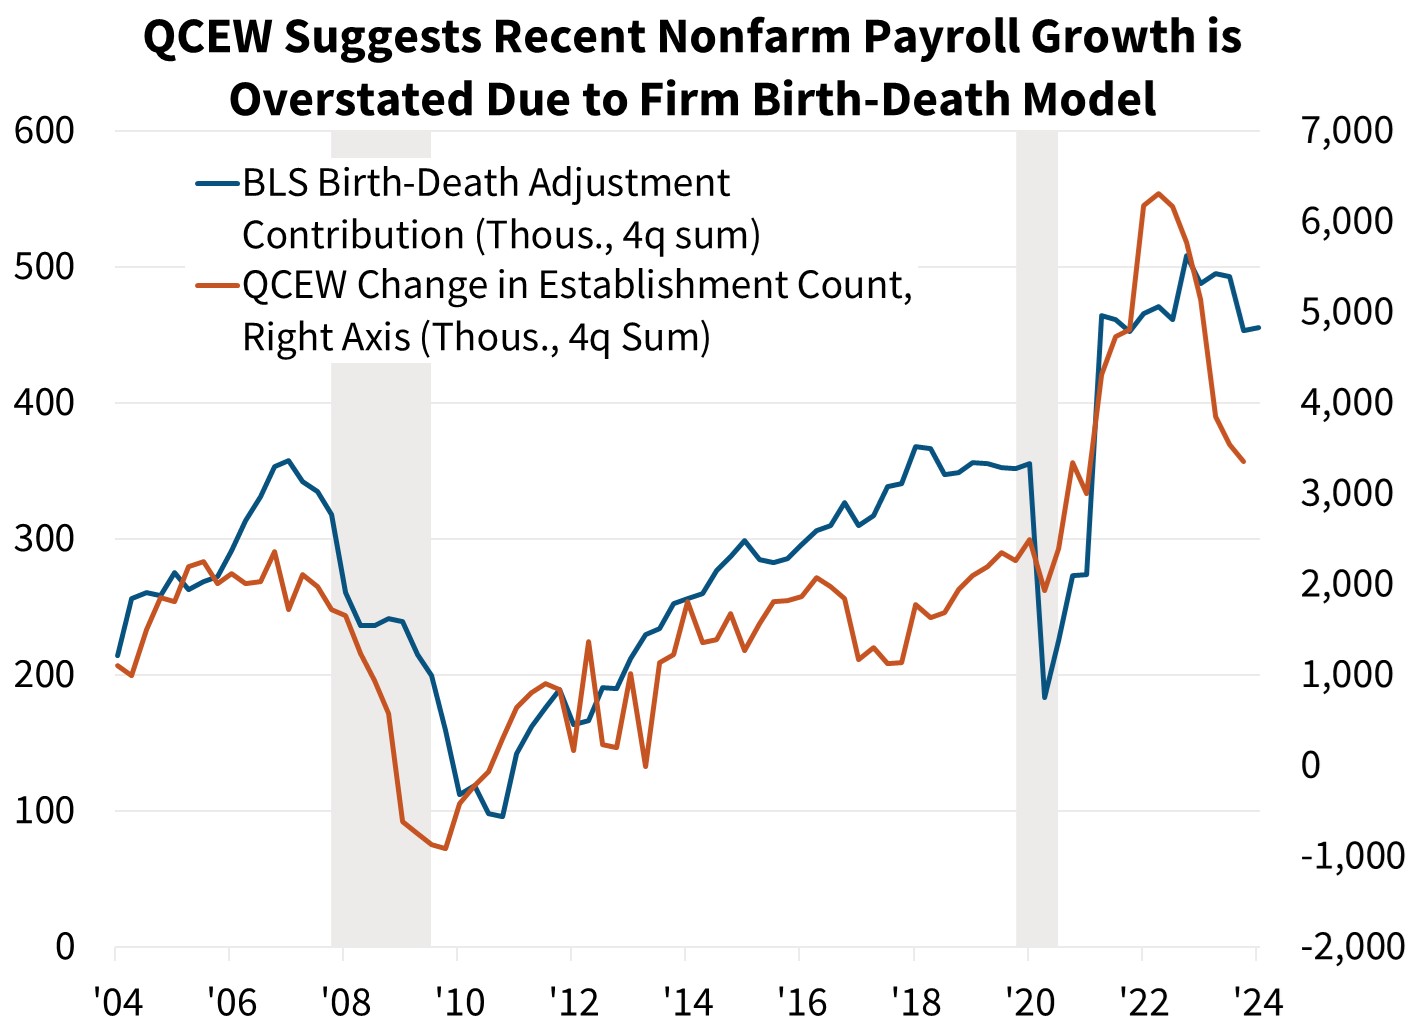
Encouraging May Inflation Reports, But More Data Needed to Confirm Trend
The Consumer Price Index (CPI) came in cooler in May than recent months, with the headline flat over the month and the core index rising only 0.2 percent month over month. On a year-over-year basis, the topline and core indices rose 3.3 percent and 3.4 percent, respectively, with both decelerating from the prior reading. The May Producer Price Index (PPI) was also encouraging, with headline PPI falling 0.2 percent over the month and decelerating on a year-over-year basis. This welcome news on the inflation front led to a significant drop in the 10-year Treasury rate and an increase in the odds of rate cuts this year. That said, the inflation data was only one month, and these series have been noisy as of late. We are looking for confirmation of additional deceleration in inflation reports before concluding that inflation is fully on track toward normalizing at the Fed's 2 percent target. We currently expect the Fed to make a rate cut in December, partly based on recent Fed guidance from its June meeting and the release of its Summary of Economic Projections (SEP). However, additional soft inflation reports, especially if combined with a growing acceptance that payroll employment is perhaps overstated, makes a September cut still a real possibility. One more point to note is that in its most recent SEP release, the FOMC upwardly raised what it expects the long-run equilibrium fed funds rate to be to 2.8 percent, up from 2.6 percent. While this has little bearing on the near term, it suggests that the ultimate resting place of interest rates, and thus mortgage rates, may be a touch higher than a lot of market participants have previously assumed.
Home Sales Soften More Than Previously Expected
Existing home sales fell 1.9 percent in April to an annualized pace of 4.14 million. This was somewhat weaker than we had anticipated, and recent purchase mortgage application data also point to near-term weakness. As such, we have downwardly revised our existing home sales outlook and now project 2024 existing sales to total 4.15 million (previously 4.20 million). This now represents only a minor increase of 1.5 percent from 2023 total year existing sales.
This sales softness is happening while listings continuing to rise. We read this divergence to mean more homeowners are no longer putting off their decision to sell, despite the so-called "lock-in effect," perhaps out of a belief that mortgage rates will remain higher for longer. However, affordability constraints are limiting the number of buyers willing and able to purchase these homes. Sellers have not been too quick to cut listing prices, but there is some evidence of this gradually occurring as Redfin reports the share of for-sale listings with price drops rising modestly, now at 6.5 percent in the most recent weekly data, up from about 4.5 percent this time last year. While home prices tend to be sticky downward, and overall the market still remains tight by historical standards, this gradual loosening of the months' supply of inventory is consistent with a deceleration in home price growth going forward. As of April, the months' supply as measured by the National Association of REALTORS® was 3.5, up from 3.0 a year prior.
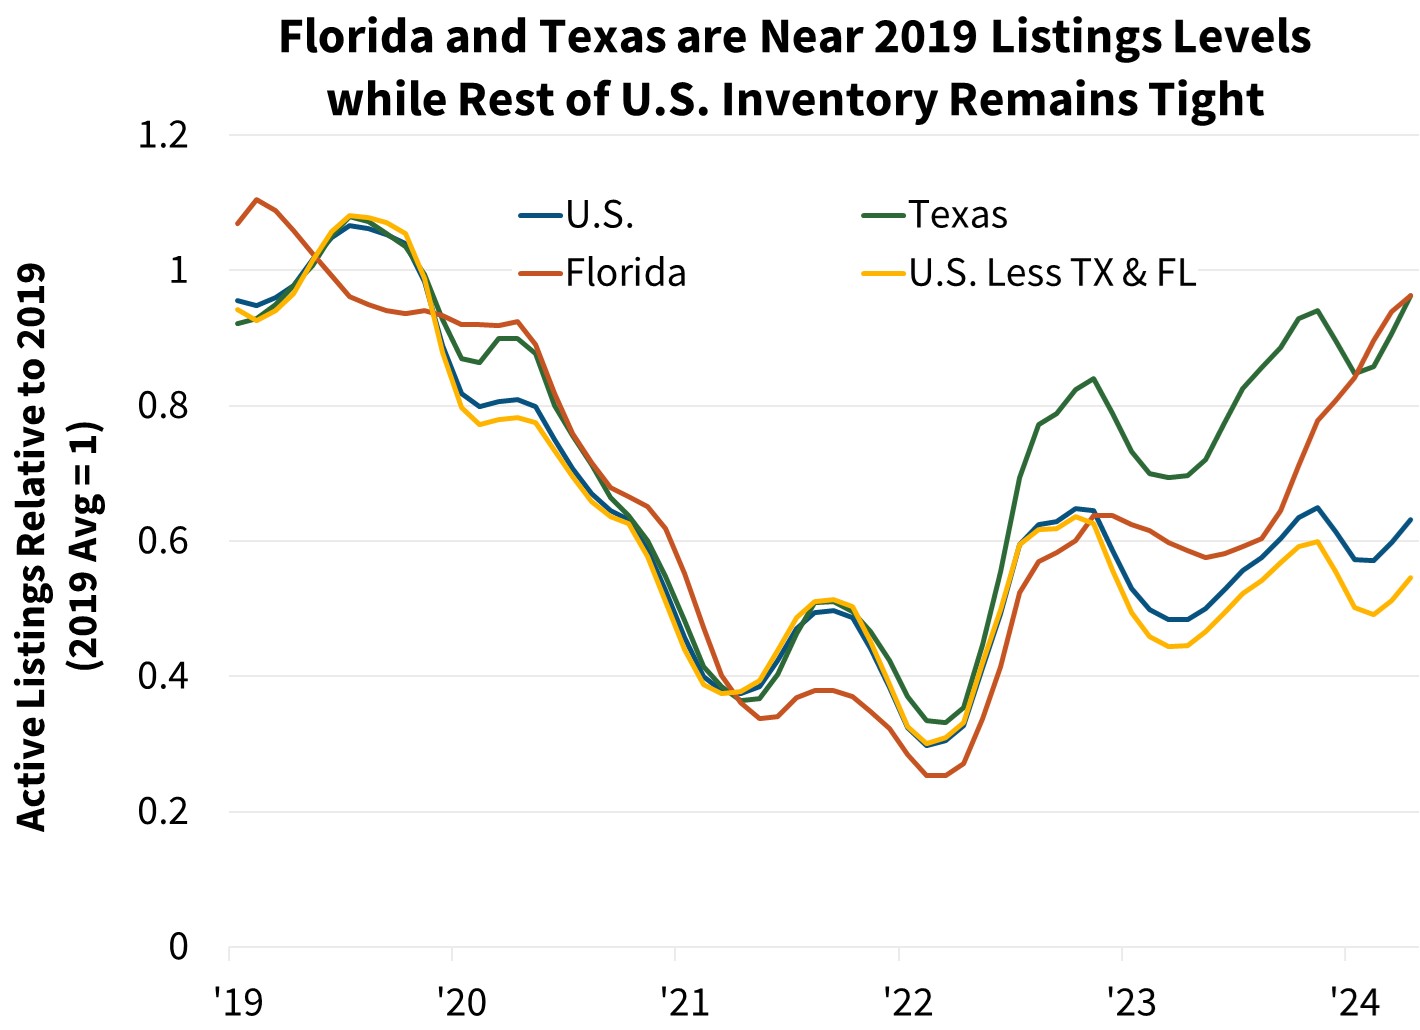
We continue to anticipate that new home construction and sales will remain comparatively strong going forward. Even in markets with growing existing home inventories, overall supply is still limited by historical comparison, and homebuilders generally continue to have adequate margins to make concessions to move inventory. The months' supply of new homes is at 9.1 as of April, the highest since November 2022. However, if existing inventory growth in the Sun Belt markets, where a disproportionate share of new sales occur, continues to rise, there could be downside risk to our new home sales and construction forecasts.
We expect Multifamily construction starts to remain modest for the foreseeable future as rent growth in many of the larger markets is soft and construction financing relatively tight. However, looking beyond 2025, when the current construction pipeline has likely been worked through, we believe an underlaying lack of housing supply relative to demographic trends should continue to support multifamily home construction.
Economic Forecast Changes
Economic Growth
The second estimate of Q1 2024 GDP showed GDP grew at an annualized 1.3 percent, three-tenths below the initial estimate. The downward revision to GDP was due to personal consumption being revised five-tenths lower than the initial estimate. Due to the base effects of the change in GDP and the weaker consumption story, we have revised downward our GDP forecast in Q2 2024 and Q3 2024, leaving the forecast for total yearly growth in 2024 on a Q4/Q4 basis at 1.6 percent, a decrease of two-tenths. However, our forecast for growth in 2025 is unchanged at 1.9 percent Q4/Q4.

Labor Market
Nonfarm payroll employment growth surprised to the upside in May, growing 272,000. The unemployment rate ticked up one-tenth to 4.0 percent. Compared to last month, we have slightly raised our unemployment rate expectations, consistent with a modest GDP growth downgrade in Q2 2024 and Q3 2024. We continue to project the unemployment rate to gradually trend upward over the course of our forecast horizon.

Inflation & Monetary Policy
Our inflation outlook was revised upward slightly, partially due to base effects and an expectation that prices are slightly stickier than we had previously thought. However, we still forecast inflation to moderate over our forecast horizon.
Our baseline expectation is now that the Fed will only cut rates once this year in December, though the May inflation report opens the possibility for more rate cuts if upcoming inflation reports move in a similar direction.

Housing & Mortgage Forecast Changes
Mortgage Rates
We revised our mortgage rate forecast downward month over month. We now forecast the 30-year fixed mortgage rate to average 6.8 percent in 2024 and 6.4 percent in 2025. However, interest rates remain volatile, particularly given changes to Fed policy expectations, which adds risk to our outlook. Following the completion of our start-of-the-month interest rate forecast and as of this writing, 10-year Treasury rates have decreased approximately 25 basis points following the May CPI release, leading to some downside risk to our current baseline mortgage rate forecast.

Existing Home Sales
Existing home sales fell to a seasonally adjusted annualized rate (SAAR) of 4.14 million in April. We revised modestly downward our near-term forecast due to incoming data, though we continue to forecast existing sales to trend gradually upward over our forecast horizon.

New Home Sales
New single-family home sales dropped 4.7 percent in April to a SAAR of 634,000. Given this, we have lowered our expectations for new home sales in Q2 2024 and Q3 2024, with the rest of the path essentially unchanged. New home sales continue to benefit from the limited inventory of existing homes for sale, which we expect to support demand for new homes over our forecast horizon.

Single-Family Housing Starts
We continue to expect that the lack of existing homes available for sale will continue to boost new home construction in the medium term, and we have kept our forecast essentially unchanged.

Multifamily Housing Starts
We have upgraded our multifamily housing starts forecast based on a reassessment of incoming data and a modestly lower interest rate path. While multifamily starts is a notoriously volatile series, we expect construction to remain subdued in the near term, but demographic trends should continue to support further multifamily construction in the intermediate term.

Single-Family Home Prices
Home prices grew 6.6 percent Q4/Q4 in 2023, according to the most recently published non-seasonally adjusted Fannie Mae Home Price Index (HPI) and are forecast to rise 4.8 percent in 2024 and 1.5 percent in 2025 on a Q4/Q4 basis. Our next home price update will be in July.
")
Single-Family Mortgage Originations
Consistent with changes to our expectation for home sales, we have revised slightly downward our expectation for purchase mortgage originations this month. We now expect purchase volume to be $1.3 trillion in 2024, representing a downward revision of $20 billion from last month's forecast. In 2025, we expect purchase originations to grow a further 14 percent to $1.5 trillion, though this level is $12 billion lower than last month's forecast as well.
In the refinance market, we have made small upward revisions to our expectations for origination volumes given the lower expected path of mortgage rates. In 2024, we expect refinance volumes to total $372 billion, growing to $544 billion in 2025. Both of these represent $4 billion upward revisions from our prior forecast.

Economic & Strategic Research (ESR) Group
June 15, 2024
For a snapshot of macroeconomic and housing data between the monthly forecasts, please read ESR's Economic and Housing Weekly Notes.
Data sources for charts: Bureau of Labor Statistics, Realtor.com
Opinions, analyses, estimates, forecasts, beliefs, and other views of Fannie Mae's Economic & Strategic Research (ESR) Group included in these materials should not be construed as indicating Fannie Mae's business prospects or expected results, are based on a number of assumptions, and are subject to change without notice. How this information affects Fannie Mae will depend on many factors. Although the ESR group bases its opinions, analyses, estimates, forecasts and other views on information it considers reliable, it does not guarantee that the information provided in these materials is accurate, current or suitable for any particular purpose. Changes in the assumptions or the information underlying these views could produce materially different results. The analyses, opinions, estimates, forecasts, beliefs, and other views published by the ESR group represent the views of that group as of the date indicated and do not necessarily represent the views of Fannie Mae or its management.
ESR Macroeconomic Forecast Team
- Doug Duncan, SVP and Chief Economist
- Mark Palim, VP and Deputy Chief Economist
- Eric Brescia, Economics Manager
- Nick Embrey, Economics Manager
- Nathaniel Drake, Economic Analyst
- Richard Goyette, Economic Analyst
- Daniel Schoshinski, Economic Analyst
- Ryan Gavin, Economic Analyst
- Eric Hardy, Economic Analyst