Economic Developments - July 2024
For a PDF version of this report, click here.
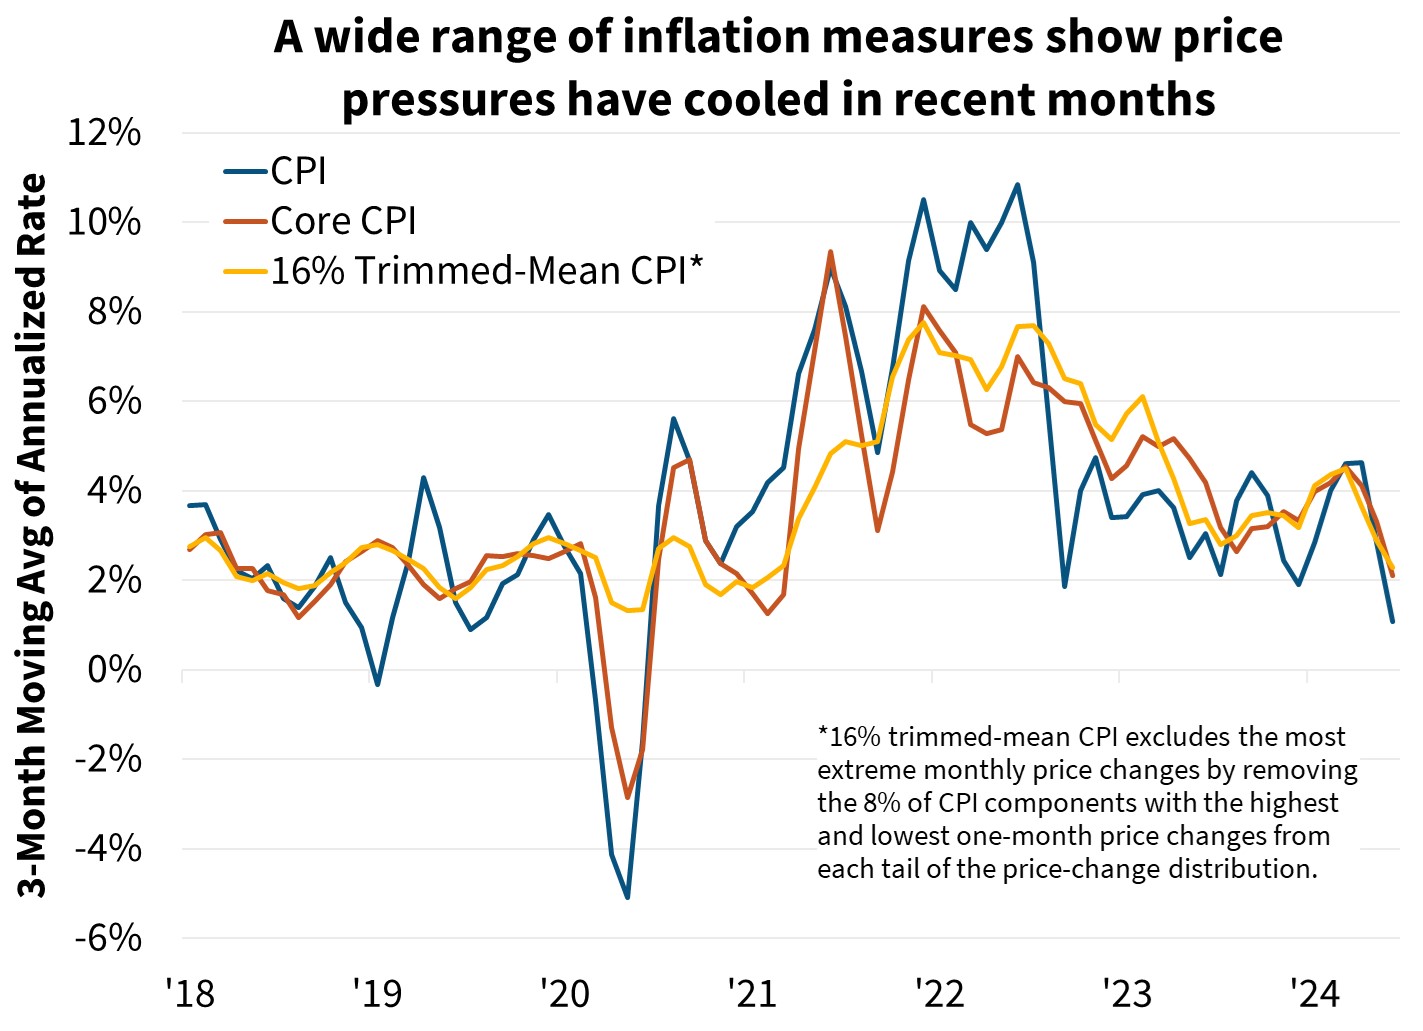
We've made only modest revisions to our economic growth outlook this month; our expectation for real Gross Domestic Product (GDP) growth in 2024 is unchanged at 1.6 percent, while our outlook for 2025 was revised upward one-tenth to 2.0 percent. More notably, given the two softer-than-expected Consumer Price Index (CPI) reports in May and June, we have revised downward our inflation forecast. We now expect the CPI to end 2024 at 2.9 percent (previously 3.2 percent), and the Federal Reserve’s preferred core Personal Consumption Expenditures (PCE) price measure to be 2.5 percent (previously 2.7 percent). We also now believe that the Federal Reserve is likely to cut rates in September and then again in December.
Home sales remain sluggish as affordability continues to constrain purchase demand, though we have modestly revised upward our existing home sales outlook due to a lower mortgage rate forecast. In contrast, we have downwardly revised our outlook for new home sales. Combined, we expect total home sales to be 4.81 million in 2024 (little changed from 4.82 million previously) and 5.26 million in 2025 (5.27 million previously).
We have also revised upward our quarterly home price forecast and now expect 2024 and 2025 prices, as measured by the Fannie Mae Home Price Index (FNM-HPI), to rise 6.1 percent and 3.0 percent, respectively. This is up from 4.8 percent and 1.5 percent in our April forecast.
The upward revision to our home price outlook drove a corresponding increase to our forecast for origination volumes; however, this was largely offset by a downward revision to our expectation for refinance activity. We now forecast 2024 originations to total $1.70 trillion (previously $1.71 trillion) and 2025 total originations to total $2.11 trillion (previously $2.07 trillion).
Incoming Data Point to Below-Trend Growth, Cooling Inflation
Recent data releases indicate that economic growth is decelerating, principally due to softening consumer spending growth, which was largely in line with our previous forecast. The third release of Q1 2024 GDP showed another downgrade to personal consumption expenditures (PCE) to 1.5 percent annualized; a full percentage point lower than originally reported. Additionally, monthly personal consumption data shows spending has not picked up much in the second quarter, suggesting consumers may finally be retrenching toward a more historically typical saving rate, a dynamic we have long expected. Spending growth in recent years has eclipsed growth in incomes, which we’ve believed was unsustainable. Business surveys, including contractionary June readings in the Institute of Supply Management’s (ISM) manufacturing and services indices, also point to below-trend growth in the near term. As such, we have left our forecast for 2024 Q4/Q4 GDP unchanged at 1.6 percent, a pace below what is believed to be the long-run growth trend.
June employment data has also shown signs of softening. While nonfarm payrolls increased by a relatively solid 206,000, the two prior months were revised downward by a combined 111,000 jobs. This brought the three-month moving average to 177,000, the slowest pace in about three and a half years. The unemployment rate also ticked up another one-tenth to 4.1 percent, four-tenths higher than where it started the year. Measures of unemployment duration are also pointing to labor market softening. While we aren’t yet concerned about significant labor market deterioration, as household balance sheets are solid in aggregate, incomes continue to grow, and unemployment claims remain in a normal range, historically, rises in the unemployment rate of the magnitude observed over the past year have often predated economic contractions and, therefore, merit monitoring.
Home Prices Come in Stronger than Expected, Regional Slowing Likely
Home prices rose 3.0 percent in the second quarter on a non-seasonally adjusted basis, as measured by the Fannie Mae Home Price Index, and were up 6.9 percent from a year earlier. While this was stronger appreciation than we had previously forecast, it still represents a deceleration from 7.3 percent annual growth in Q1. We have modestly upgraded our home price outlook for 2024 largely based on these stronger incoming data for the first half of the year, but we continue to expect deceleration going forward as affordability constraints weigh on home purchase demand.
For-sale active listings continue to rise on a year-over-year basis and are now up 37 percent as of June, according to Realtor.com. Despite the rise in listings, the pace of sales remains subdued. Existing home sales are down 2.8 percent from a year ago in May. This growing gap between listings and sales growth is leading to comparative loosening in the housing market as affordability appears to be holding many buyers back. Redfin’s demand index, which measures requests for showings and listing views, is down 17 percent from a year ago, while the weekly share of listings experiencing a price cut was 6.5 percent as of the week ending July 7, up from 5.5 percent over the corresponding week a year prior.
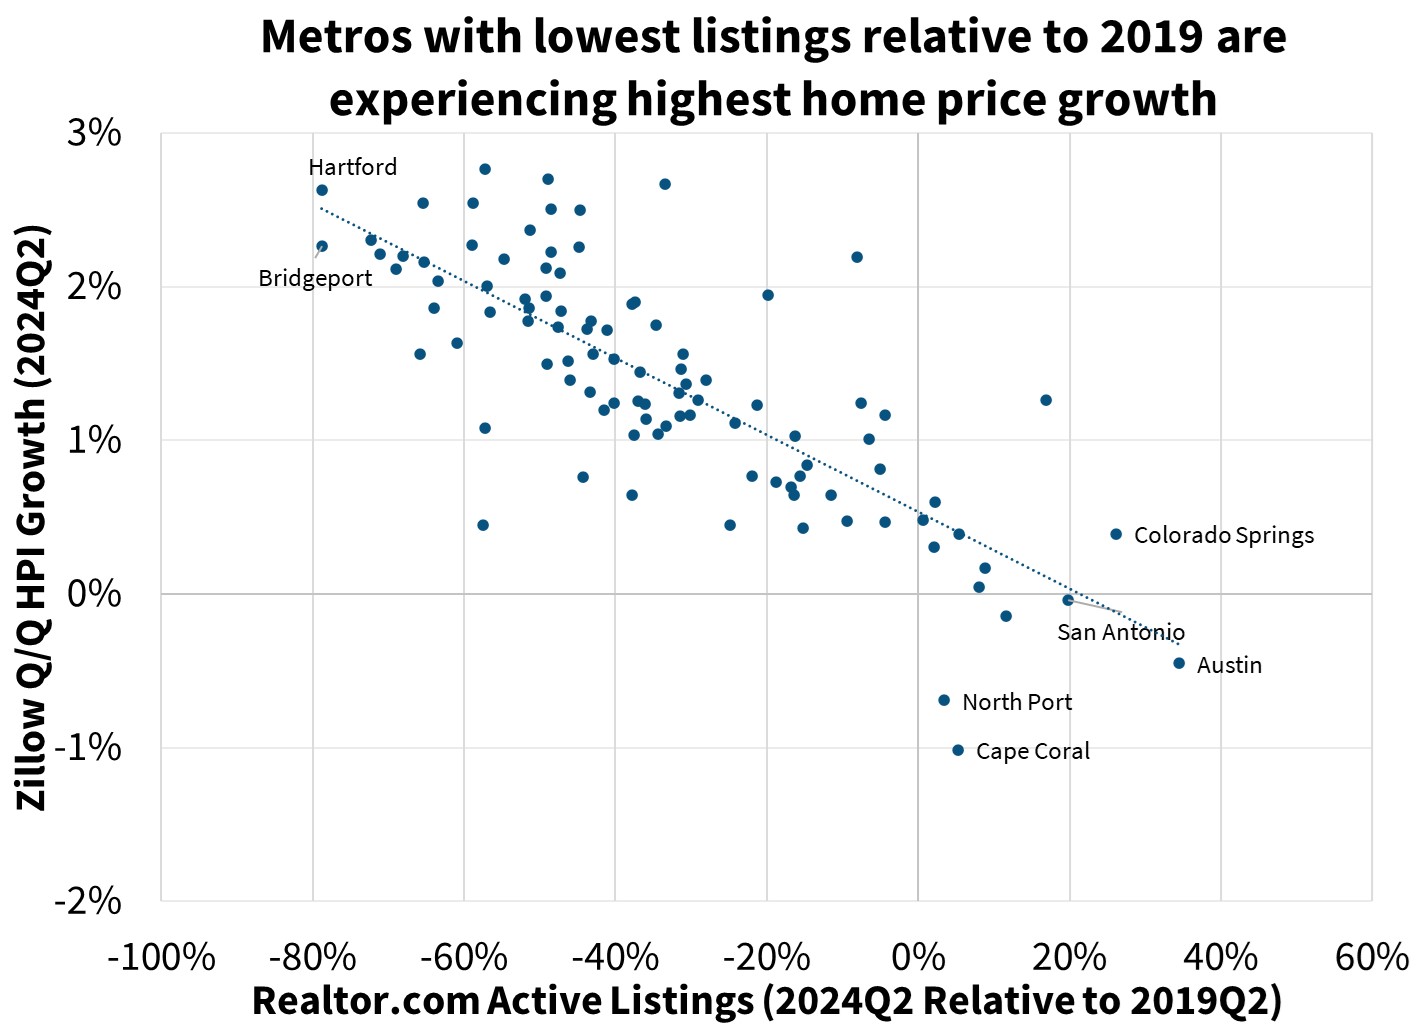
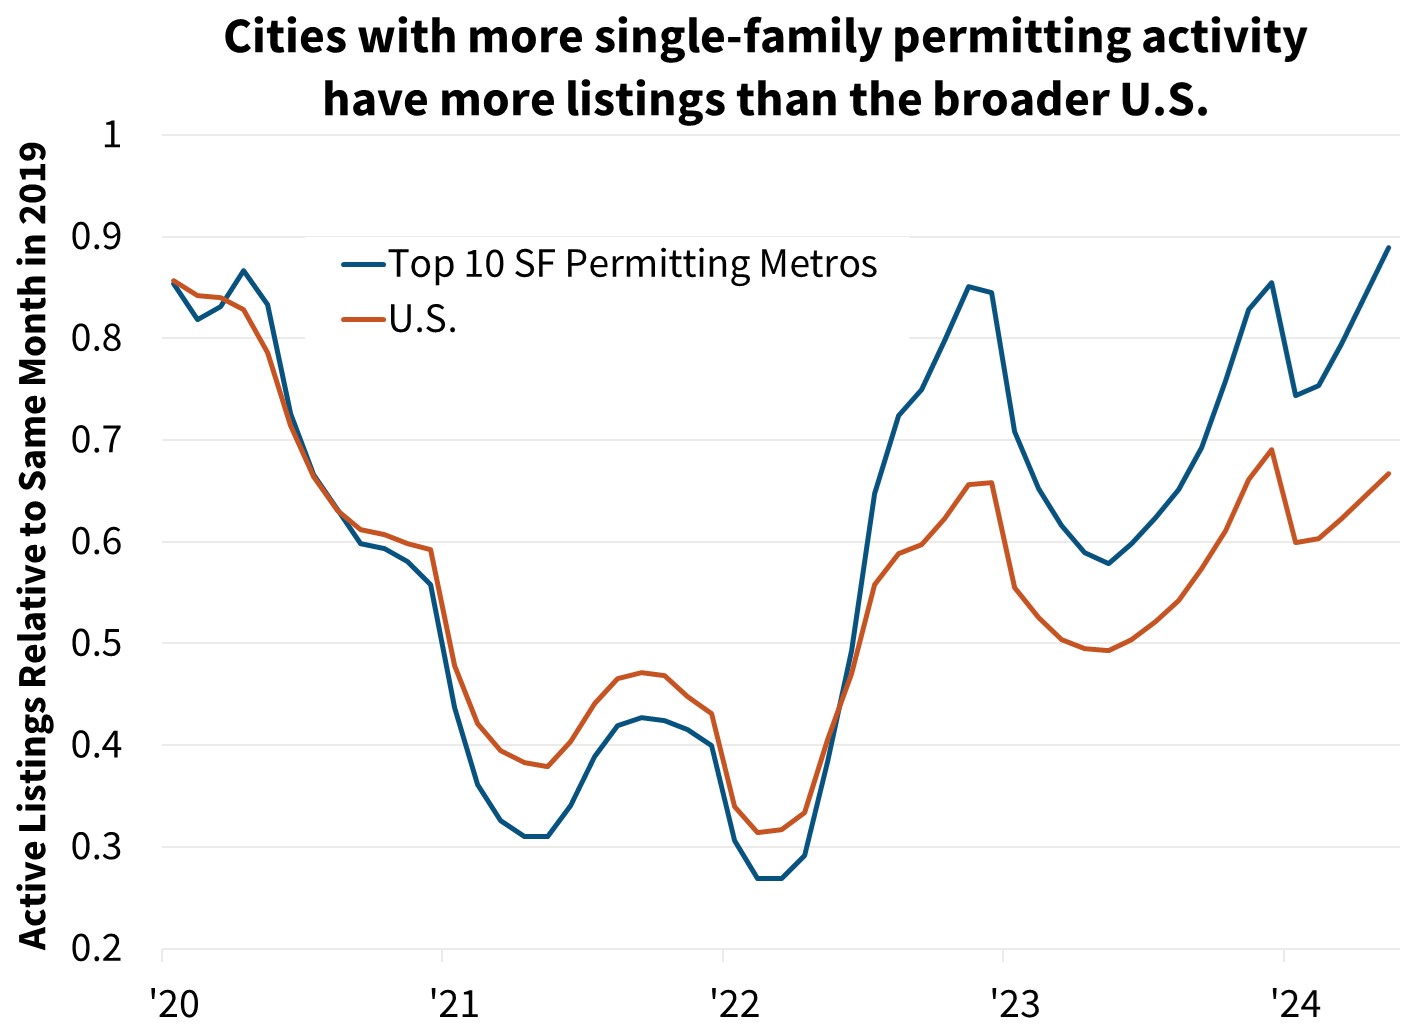
At least some of this regional listing and price divergence is likely due to variations in homebuilding activity over recent years. Many of these sunbelt metros have experienced a comparative boom in building post-pandemic, and this added supply is likely easing some of the price pressures. We also suspect some of the softening demand in Sunbelt areas is due to demand previously being pulled forward following the pandemic, as many households accelerated their retirement move plans and second home purchases.
Economic Forecast Changes
Economic Growth
The third estimate of Q1 2024 GDP showed GDP grew at an annualized 1.4 percent, one-tenth above the second estimate. Recent actual data was in line with our expectation of a slowdown in consumer spending growth; therefore, our GDP outlook is essentially unchanged. Our GDP forecast for total yearly growth in 2024 on a Q4/Q4 basis remains at 1.6 percent. Our forecast for growth in 2025 was revised upward by one-tenth to 2.0 percent Q4/Q4.

Labor Market
Nonfarm payroll employment growth remained robust in June, growing by 206,000, though estimates for the two prior months were revised downward by a combined 111,000 jobs. The unemployment rate ticked upward one-tenth to 4.1 percent and has now risen three-tenths since March. Given this, we have raised our unemployment rate expectations through the end of 2025, as we continue to expect the labor market to cool gradually.

Inflation & Monetary Policy
Our inflation outlook was revised downward following the weaker-than-expected May and June inflation readings. We continue to forecast inflation to moderate over our forecast horizon.
Given the weaker inflation numbers and signs of cooling in the labor market, our baseline expectation is now that the Fed will cut rates twice this year, in September and December.

Housing & Mortgage Forecast Changes
Mortgage Rates
We revised our mortgage rate forecast downward month over month. We now forecast the 30-year fixed mortgage rate to average 6.8 percent in 2024 and 6.4 percent in 2025. However, interest rates remain volatile, particularly given changes to Fed policy expectations, which adds risk to our outlook. Following the completion of our start-of-the-month interest rate forecast and as of this writing, 10-year Treasury rates have decreased approximately 25 basis points following the May CPI release, leading to some downside risk to our current baseline mortgage rate forecast.

Existing Home Sales
Existing home sales fell slightly to a seasonally adjusted annualized rate (SAAR) of 4.11 million in May. We revised modestly upward our near-term forecast due to the lower mortgage rate path, and we continue to forecast existing sales to trend gradually upward over our forecast horizon.

New Home Sales
New single-family home sales plunged 11.3 percent in May to a SAAR of 619,000, though there was a large upward revision to the April number, leaving the average of new sales in April and May modestly above our second quarter forecast. However, continued increases in available existing homes-for-sale in key regions suggest demand for new homes will cool, and that there may be more downward momentum in the near term than previously expected.

Single-Family Housing Starts
We’ve revised downward our expectation for single-family starts, as incoming data point to a weaker near-term outlook for single-family construction. Starts fell in May slightly more than expected, and other indicators, such as the continued decline in permits along with the lowest homebuilder confidence reading this year, suggest a lower path.

Multifamily Housing Starts
We have downgraded our multifamily housing starts forecast based on a reassessment of incoming data. While the multifamily starts series is notoriously volatile, we expect construction to remain subdued in the near term. However, we believe demographic trends are likely to continue to support further multifamily construction in the intermediate term.

Single-Family Home Prices
Home prices grew 6.0 percent Q4/Q4 in 2023, according to the most recently published non-seasonally adjusted Fannie Mae Home Price Index (FNM-HPI), a downgrade of six-tenths from last quarter’s estimate. We now forecast national home prices to rise 6.1 percent in 2024 and 3.0 percent in 2025 on a Q4/Q4 basis, upward revisions of 1.2 and 1.4 percentage points, respectively. Our next home price update will be in October.
")
Single-Family Mortgage Originations
This month we have upgraded our expectation for 2024 purchase origination volumes by $14 billion from the prior month’s forecast, driven by our higher home price growth expectations. We now expect home prices to grow 6.1 percent in 2024 compared to 4.8 percent in the prior forecast. In 2025, we expect purchase volumes to grow by 14 percent year over year to $1.6 trillion, representing an upgrade of $26 billion from last month’s forecast.
We have downgraded our expectation for refinance originations in 2024 by $26 billion relative to last month's forecast to $346 billion, in line with recent data on mortgage applications from the Fannie Mae Refinance Application-Level Index (RALI). We expect refinance volumes to grow to $563 billion in 2025 as home prices continue to rise and mortgage rates gradually fall.

Economic & Strategic Research (ESR) Group
July 15, 2024
For a snapshot of macroeconomic and housing data between the monthly forecasts, please read ESR's Economic and Housing Weekly Notes.
Data sources for charts: Bureau of Labor Statistics, Realtor.com, Zillow, Fed Reserve Bank of Cleveland
Opinions, analyses, estimates, forecasts, beliefs, and other views of Fannie Mae's Economic & Strategic Research (ESR) Group included in these materials should not be construed as indicating Fannie Mae's business prospects or expected results, are based on a number of assumptions, and are subject to change without notice. How this information affects Fannie Mae will depend on many factors. Although the ESR group bases its opinions, analyses, estimates, forecasts and other views on information it considers reliable, it does not guarantee that the information provided in these materials is accurate, current or suitable for any particular purpose. Changes in the assumptions or the information underlying these views could produce materially different results. The analyses, opinions, estimates, forecasts, beliefs, and other views published by the ESR group represent the views of that group as of the date indicated and do not necessarily represent the views of Fannie Mae or its management.
ESR Macroeconomic Forecast Team
- Doug Duncan, SVP and Chief Economist
- Mark Palim, VP and Deputy Chief Economist
- Eric Brescia, Economics Manager
- Nick Embrey, Economics Manager
- Nathaniel Drake, Economic Analyst
- Richard Goyette, Economic Analyst
- Daniel Schoshinski, Economic Analyst
- Ryan Gavin, Economic Analyst
- Eric Hardy, Economic Analyst