Economic Developments - August 2024
For a PDF version of this report, click here.
Stronger-than-expected second quarter real gross domestic product (GDP) data drove an upgrade to our 2024-year total GDP growth forecast; however, we continue to expect decelerating consumer spending and employment growth for the back half of the year. Taken together, we have upwardly revised our 2024 GDP growth forecast to 1.9 percent from 1.6 percent, while downgrading 2025 from 2.0 percent to 1.8 percent. We continue to expect a soft landing as inflation cools, despite our changing the timing of that growth modestly. The recent jump in the unemployment rate to 4.3 percent helped drive a growth scare and related volatility in equity markets. More recent data appear to have soothed many market fears of quickly deteriorating economic activity, though long-term interest rates remain significantly lower than a month ago as of this writing. This has led to some modest declines in mortgage rates; however, high frequency data is showing little evidence of a mortgage rate-related rebound in home sales. Taken as a whole, we've revised downward our total home sales forecast for 2024 to 4.78 million (previously 4.81 million) and in 2025 to 5.19 million (previously 5.26 million). We project the 30-year fixed rate mortgage rate to end the year around 6.4 percent and move toward 5.9 percent by the end of 2025. Our projection for total mortgage originations in 2024 was essentially unchanged at $1.7 trillion, while our outlook for 2025 was revised upward slightly to $2.2 trillion, with an upgrade in refinance originations largely offsetting a downward revision to purchase originations.
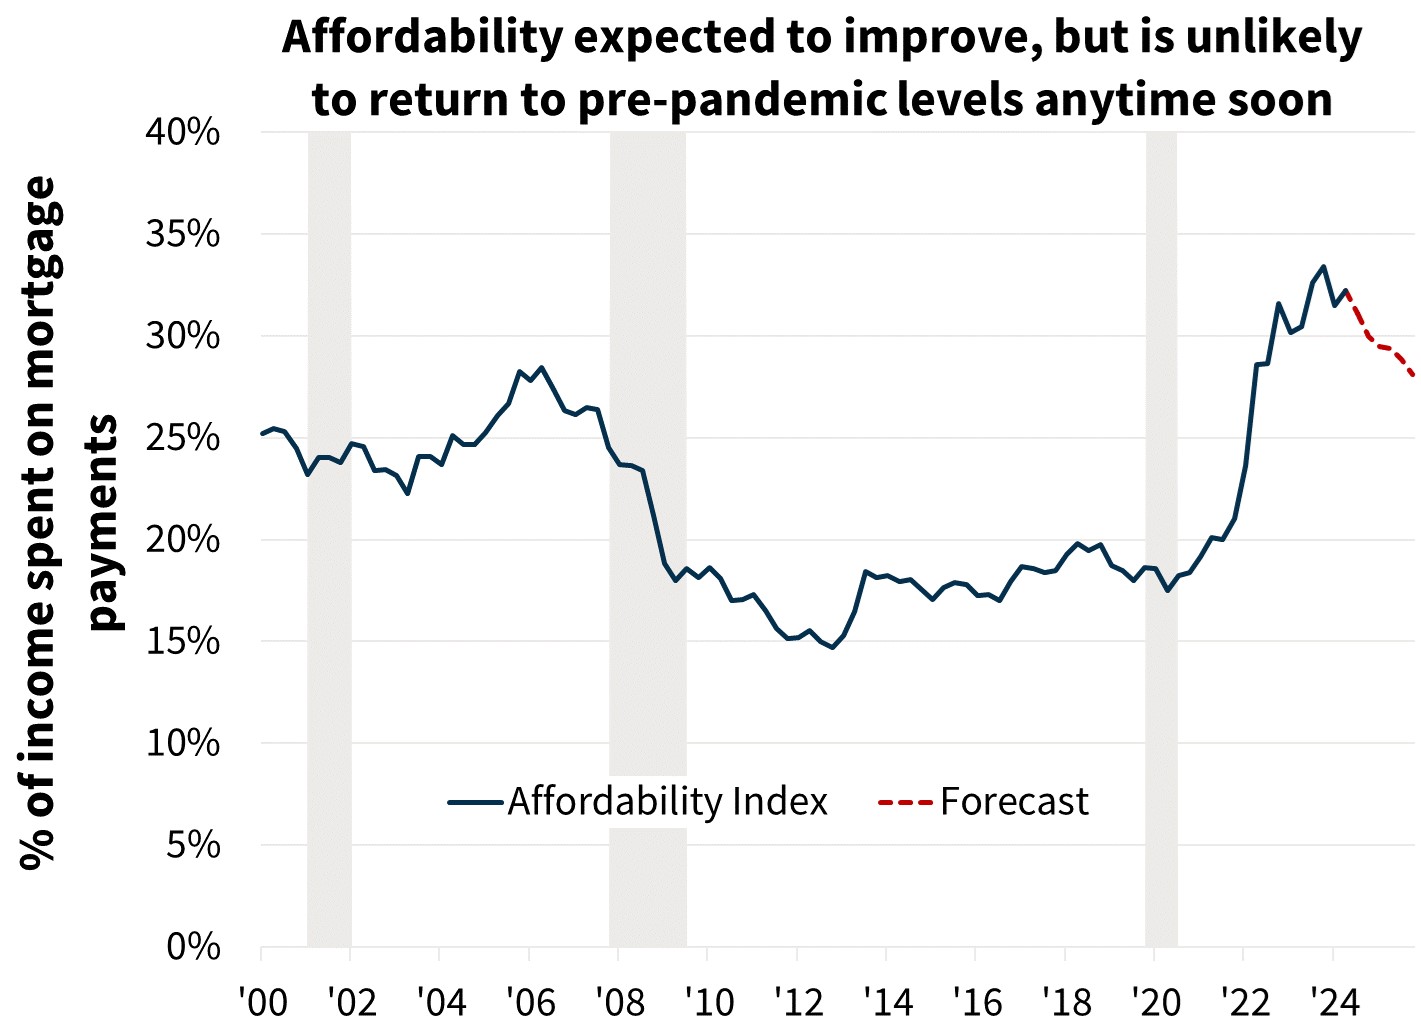
Home sales remain sluggish as affordability continues to constrain purchase demand, though we have modestly revised upward our existing home sales outlook due to a lower mortgage rate forecast. In contrast, we have downwardly revised our outlook for new home sales. Combined, we expect total home sales to be 4.81 million in 2024 (little changed from 4.82 million previously) and 5.26 million in 2025 (5.27 million previously).
Labor Market Data Caused a Growth Scare, but Continued Expansion Still Expected
Second quarter GDP came in stronger than expected at 2.8 percent annualized, pointing again to the resilience of consumer spending that should provide some momentum into Q3. However, consumers are continuing to spend at a pace in excess of disposable income growth – the savings rate dipped by another tenth in June to 3.4 percent, compared to a pre-pandemic normal of around 6-7 percent. With a projection for decelerating home prices, wealth-effect driven consumption that has likely helped suppress the savings rate should slow moving forward, and we expect income and spending growth to come into greater alignment. Consumer credit growth has recently been weak, while delinquency rates have risen, suggesting stress in some consumer segments.
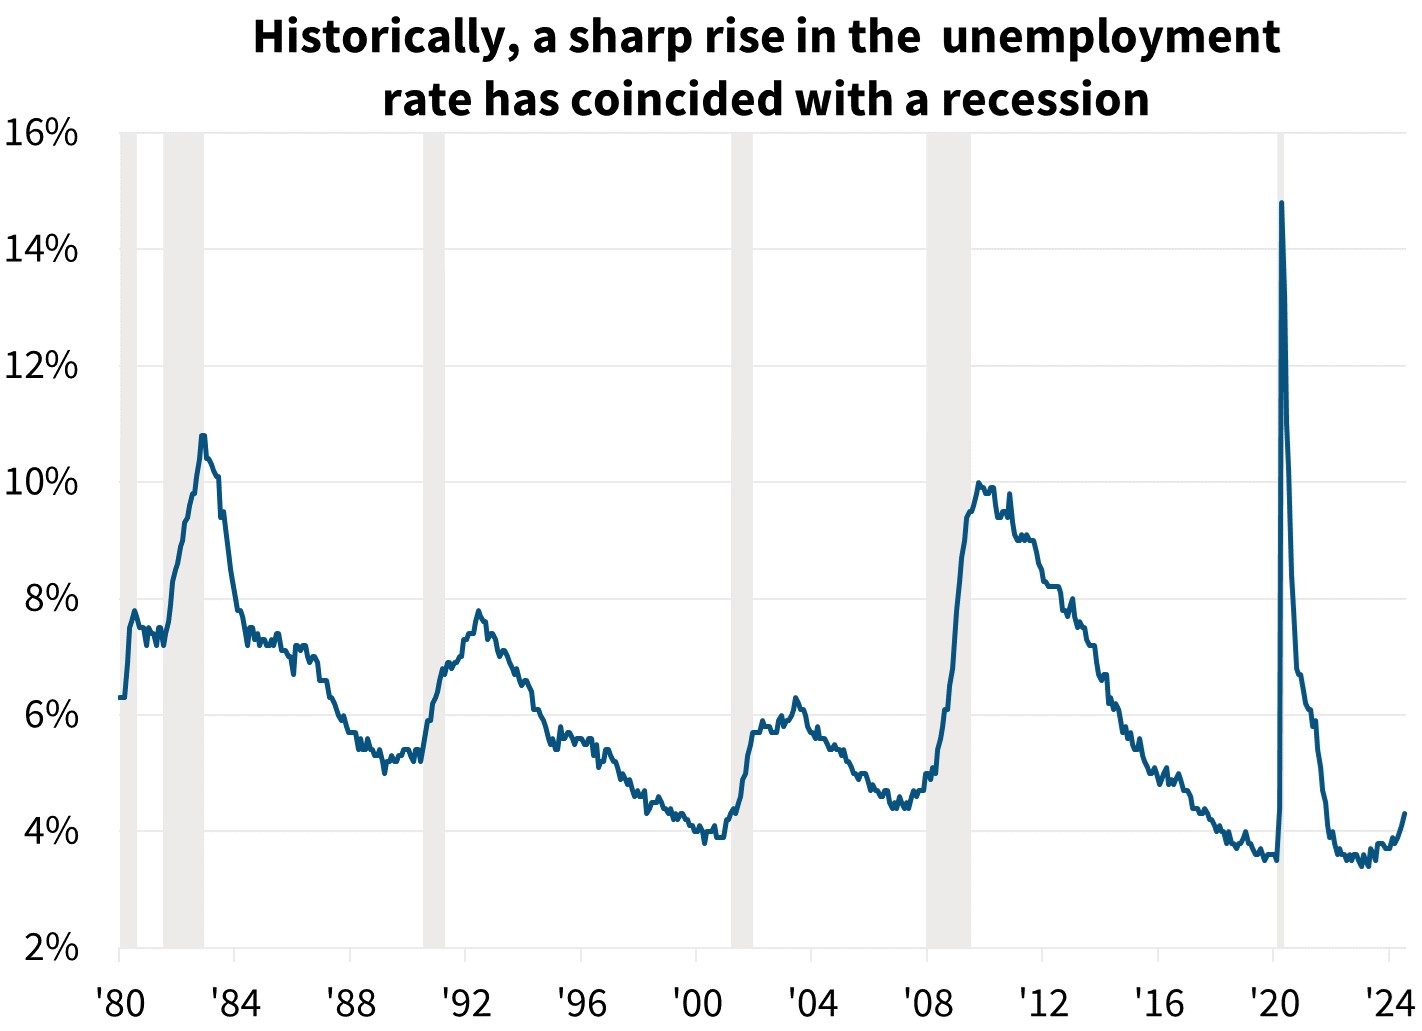
However, the recent jump in the unemployment rate to 4.3 percent was at least partially due to temporary layoffs that may have stemmed from weather events and other non-cyclical factors such as the retooling of auto plants. Additionally, much of the rise this past half year has been due to re- and new entrants into the labor force, rather than a steep rise in permanent layoffs. We see this as consistent with our broader GDP forecast that shows a significant slowdown in growth by the end of the year, but still attaining a "soft landing" as inflation continues to decelerate. We also see a slower pace of hiring and quits combined with little evidence of heightened layoffs from the Job Openings and Labor Turnover Survey (JOLTS) consistent with this view. Still, we note that the odds of a downturn have increased relative to our prior outlook.
Bond markets following the labor report were pricing in a near-guaranteed chance of a 50-basis point cut to the Fed Funds rate in September but, as of this writing, had reduced those odds to only 25 percent following less worrisome data. The July Consumer Price Index (CPI) report continued to show progress toward the Fed’s inflation target but not evidence of a sudden collapse in demand, and subdued unemployment claims suggest the labor market is not deteriorating. In line with current market views, we expect a 25-basis point cut in September. However, the August employment report, in which we are expecting the unemployment rate to pull back a tick, will likely have a meaningful impact on market expectations of future interest rates, depending on whether it shows continued weakening at the pace of the July report or not. Still, with inflation continuing to decelerate and labor markets softening to at least some extent, a period of rate cuts going forward is expected, but the magnitude and speed of such cuts is highly conditional on incoming data.
Home Sales Poised to Stay Lower for Longer
We have revised downward our existing home sales forecast despite a lower mortgage rate outlook this month. In June, existing sales fell 5.4 percent to an annualized pace of 3.89 million, weaker than we had anticipated. Furthermore, there has been little evidence in high frequency data pointing to any meaningful movement in home purchase activity in recent weeks despite the pullback in mortgage rates. Purchase mortgage applications, as measured by the Mortgage Bankers Association, have hardly budged in recent weeks, and Redfin's Homebuyer Demand Index, which tracks the number of showing requests and listing views, has not risen and remains 10 percent below activity levels from a year prior. Furthermore, the most recent reading of Fannie Mae's Home Purchase Sentiment Index® continues to point to a near-record low share of respondents indicating it is a "good time" to buy.
Active inventories of homes for sale have been rising throughout this year, but this increase has not been because of a robust rise in listings of homes added to the market. Rather, while new listings have risen modestly, the main driver is the fact that these listings have not been met with any increase in actual home sales, and therefore total inventories are rising and the average time on the market is increasing. We therefore now expect demand to remain suppressed and for a meaningful move upward in sales to be delayed until later in 2025.
It should also be noted that many of the above dynamics currently vary greatly be region. Rising for-sale active inventories are, on net, exclusively due to the South and Mountain West states, while inventories have hardly budged on average for the rest of the country. We see multiple factors driving this. The Sunbelt has had a stronger construction boom in recent years following the pandemic, so added supply is loosening up the market, which will ultimately aid affordability. The Sunbelt also had a disproportionate in-migration wave following the pandemic, and some of these movers likely represented demand being pulled forward, so we are now in the give-back period of this pull-forward in demand. And lastly, while the Sunbelt still has comparatively less expensive homes than many Northeast and West Coast metros, the relative shift in affordability has been much more severe in recent years, so the normal pool of buyers are likely more stretched. This is particularly true in some states, for example Florida, where insurance rates have also risen greatly in recent years, further constraining affordability.
Economic Forecast Changes
Economic Growth
The preliminary estimate of Q2 2024 GDP showed that GDP grew at an annualized 2.8 percent, above consensus and our expectation. This higher starting level led to an upward revision to our Q3 forecast, though we maintain our expectation of weakness in Q4 and the first half of 2025. Our GDP forecast for total yearly growth in 2024 on a Q4/Q4 basis was revised upward three-tenths to 1.9 percent. Our forecast for growth in 2025 was revised downward two-tenths to 1.8 percent Q4/Q4.

Labor Market
Nonfarm payroll employment growth was muted in July, growing by just 114,000. The more concerning portion of the report was the rise in the unemployment rate, which moved upward two-tenths to 4.3 percent and has now risen five-tenths since March. Given this, we have raised our unemployment rate expectations through the end of 2025, as we continue to expect the labor market to cool at a gradual pace.

Inflation & Monetary Policy
Our inflation outlook was revised downward following the weaker-than-expected inflation readings and a downward revision to our medium-term oil price outlook. We continue to forecast inflation to moderate over our forecast horizon.
Given the weaker inflation numbers and signs of cooling in the labor market, our baseline expectation remains that the Fed will begin to cut the short-term rate in September by 25 basis points, though the chance of a 50-basis point cut in September remains elevated, according to the CME's FedWatch tool.

Housing & Mortgage Forecast Changes
Mortgage Rates
We revised downward our mortgage rate forecast for 2024 given the recent decline in longer-term interest rates. We now forecast the 30-year fixed mortgage rate to average 6.7 percent in 2024 (down one-tenth from last month’s forecast) and to average 6.0 percent in 2025, down four-tenths. However, interest rates remain volatile, particularly given changes to Fed policy expectations, which adds risk to our outlook. Following the completion of our beginning-of-the-month interest rate forecast and as of this writing, 10-year Treasury rates have decreased approximately 19 basis points following the July jobs report, leading to some downside risk to our current baseline mortgage rate forecast.

Existing Home Sales
Existing home sales fell 5.35 percent to a seasonally adjusted annualized rate (SAAR) of 3.89 million in June. We revised downward our forecast for existing home sales, despite the lower mortgage rate path, given the weakness in recent sales and high-frequency indicators such as purchase applications. However, we continue to forecast existing sales to trend gradually upward over our forecast horizon as affordability improves.

New Home Sales
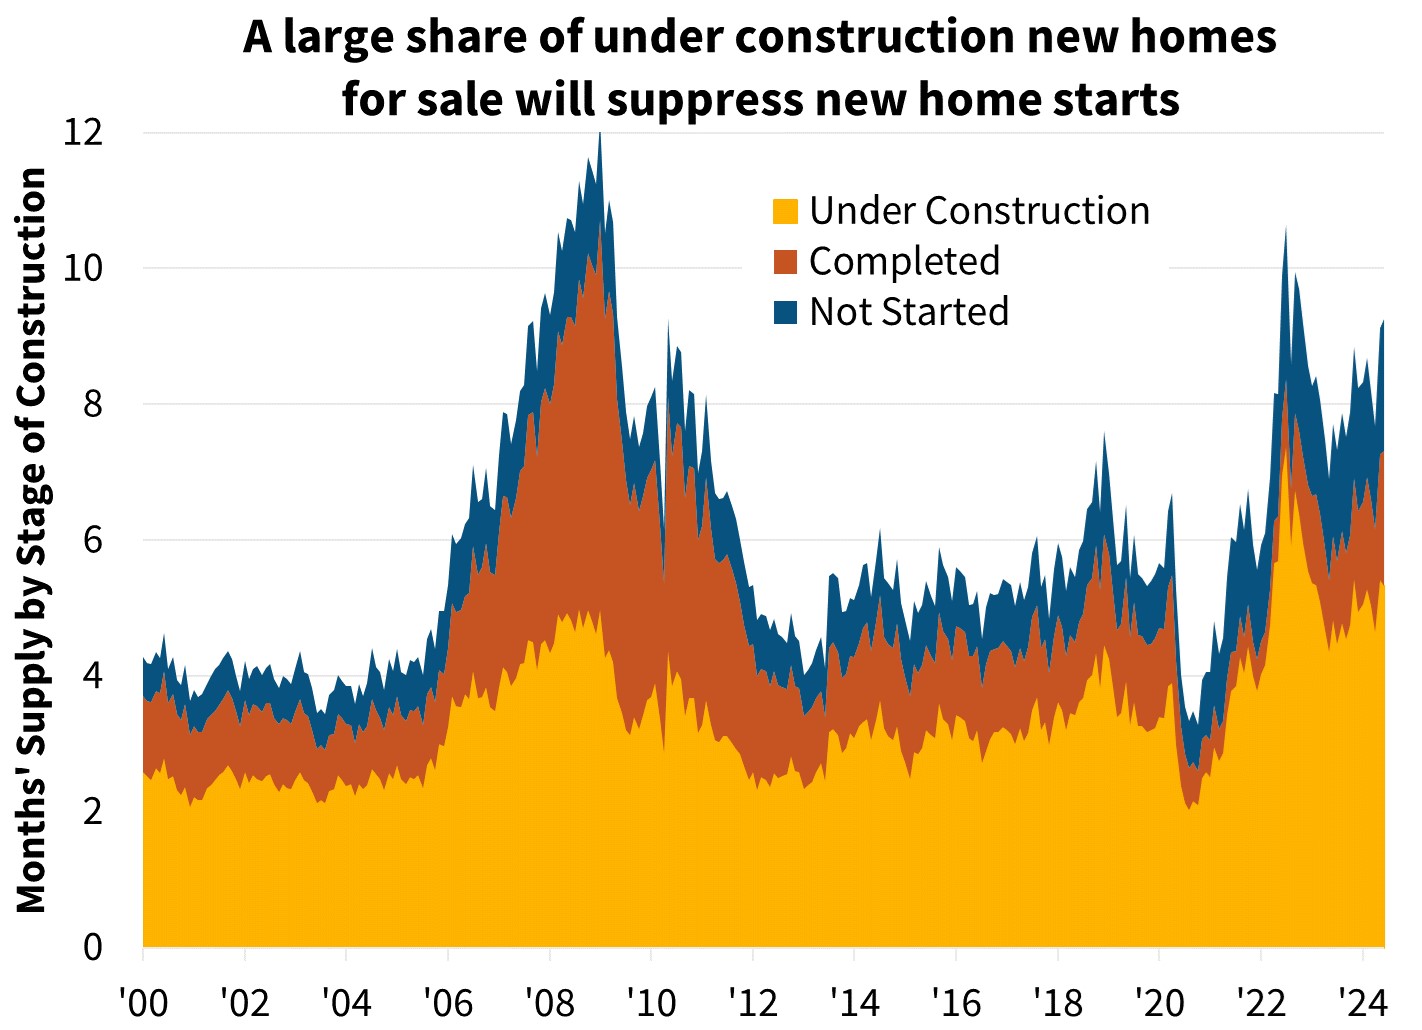
New single-family home sales fell 0.6 percent in June to a SAAR of 617,000. We have made minor changes throughout the new home sales outlook, but we continue to expect the dearth of existing homes being listed for sale to help support new home sales and lead to a gradual increase over the forecast horizon.

Single-Family Housing Starts
We've revised downward our expectation for single-family starts, as incoming data point to a weaker near-term outlook for single-family construction as well as a growing stock of homes for sale already started. Starts fell in June, and other indicators, such as the continued decline in permits along with low homebuilder confidence, continue to suggest a lower path.

Multifamily Housing Starts
We have upgraded our multifamily housing starts forecast based on stronger recent incoming data at the time we finalized the forecast. While the multifamily starts series is notoriously volatile, we continue to believe demographic trends will continue to support further multifamily construction in the intermediate term.

Single-Family Home Prices
Home prices grew 6.0 percent Q4/Q4 in 2023, according to the most recently published non-seasonally adjusted Fannie Mae Home Price Index (FNM-HPI), a downgrade of six-tenths from last quarter’s estimate. We forecast national home prices to rise 6.1 percent in 2024 and 3.0 percent in 2025 on a Q4/Q4 basis, upward revisions of 1.2 and 1.4 percentage points, respectively, from our April forecast. Our next home price update will be in October.
")
Single-Family Mortgage Originations
We have revised downward our forecast for purchase mortgage originations in both 2024 and 2025, despite the lower expected mortgage rate path. We now expect 2024 purchase volume to be $1.325 trillion, $31 billion lower than last month’s forecast, given the somewhat weaker projected path for home sales. In 2025, we expect purchase volumes to grow by 15 percent to $1.518 trillion, a level that has also been revised downward from the prior forecast.
In the refinance market, we have revised upwards our expectation for 2024 volumes by $28 billion to $374 billion, driven by the more optimistic mortgage rate path leading to an increased refinance incentive. Refinance activity in 2025 is now expected to be $627 billion, an upward revision of $64 billion compared to the prior forecast. These revisions take into account the recent readings from the Fannie Mae Refinance Application-Level Index (RALI), indicating refinance application activity has crept upward lately from previously anemic levels, given the decline in rates over the relevant period.

Economic & Strategic Research (ESR) Group
August 15, 2024
For a snapshot of macroeconomic and housing data between the monthly forecasts, please read ESR's Economic and Housing Weekly Notes.
Data sources for charts: Bureau of Labor Statistics, Census Bureau, National Association of REALTORS®, Freddie Mac, Fannie Mae ESR
Opinions, analyses, estimates, forecasts, beliefs, and other views of Fannie Mae's Economic & Strategic Research (ESR) Group included in these materials should not be construed as indicating Fannie Mae's business prospects or expected results, are based on a number of assumptions, and are subject to change without notice. How this information affects Fannie Mae will depend on many factors. Although the ESR group bases its opinions, analyses, estimates, forecasts and other views on information it considers reliable, it does not guarantee that the information provided in these materials is accurate, current or suitable for any particular purpose. Changes in the assumptions or the information underlying these views could produce materially different results. The analyses, opinions, estimates, forecasts, beliefs, and other views published by the ESR group represent the views of that group as of the date indicated and do not necessarily represent the views of Fannie Mae or its management.
ESR Macroeconomic Forecast Team
- Doug Duncan, SVP and Chief Economist
- Mark Palim, VP and Deputy Chief Economist
- Eric Brescia, Economics Manager
- Nick Embrey, Economics Manager
- Eric Hardy, Economic Analyst
- Nathaniel Drake, Economic Analyst
- Richard Goyette, Economic Analyst
- Daniel Schoshinski, Economic Analyst
- Ryan Gavin, Economic Analyst